KoreaDevKNOWLEDGE SHARING

Content typeLearn

AI INFRASTRUCTURE · 03 / 12

Interconnects and AI fabrics

Connect everything from the server's internal bus to Ethernet, InfiniBand, RDMA, and the scale-out fabric, and accept link state based on evidence.

Difficulty
Intermediate
Structure
Core units 4 · Judgment activities · Three-stage assessment

NEW HIRE ONBOARDING

Start in the order you would receive your first assignment

So that even a new hire with no prior IT background can follow along, we start with the situation, the task, the evidence, and when to report, before difficult definitions.

  1. 01

    Read the situation in one sentence

    Link the layer-by-layer counters from the physical signal through routing, queues, RDMA and the distributed workload to build the rationale for a cable replacement or a configuration change.

  2. 02

    Today's assignment

    Document the stop conditions and recovery evidence for cabling and fabric acceptance testing in a work record.

  3. 03

    Evidence that shows the work is complete

    Reviewed against official documentation and training output. Commands and performance tests on real hardware are unconfirmed.

  4. 04

    When to stop and ask a senior colleague

    Among 8 nodes, only one node has low RDMA throughput and rising symbol errors. What is your first action?

Unpack unfamiliar terms first

Carrier (physical signal detection)
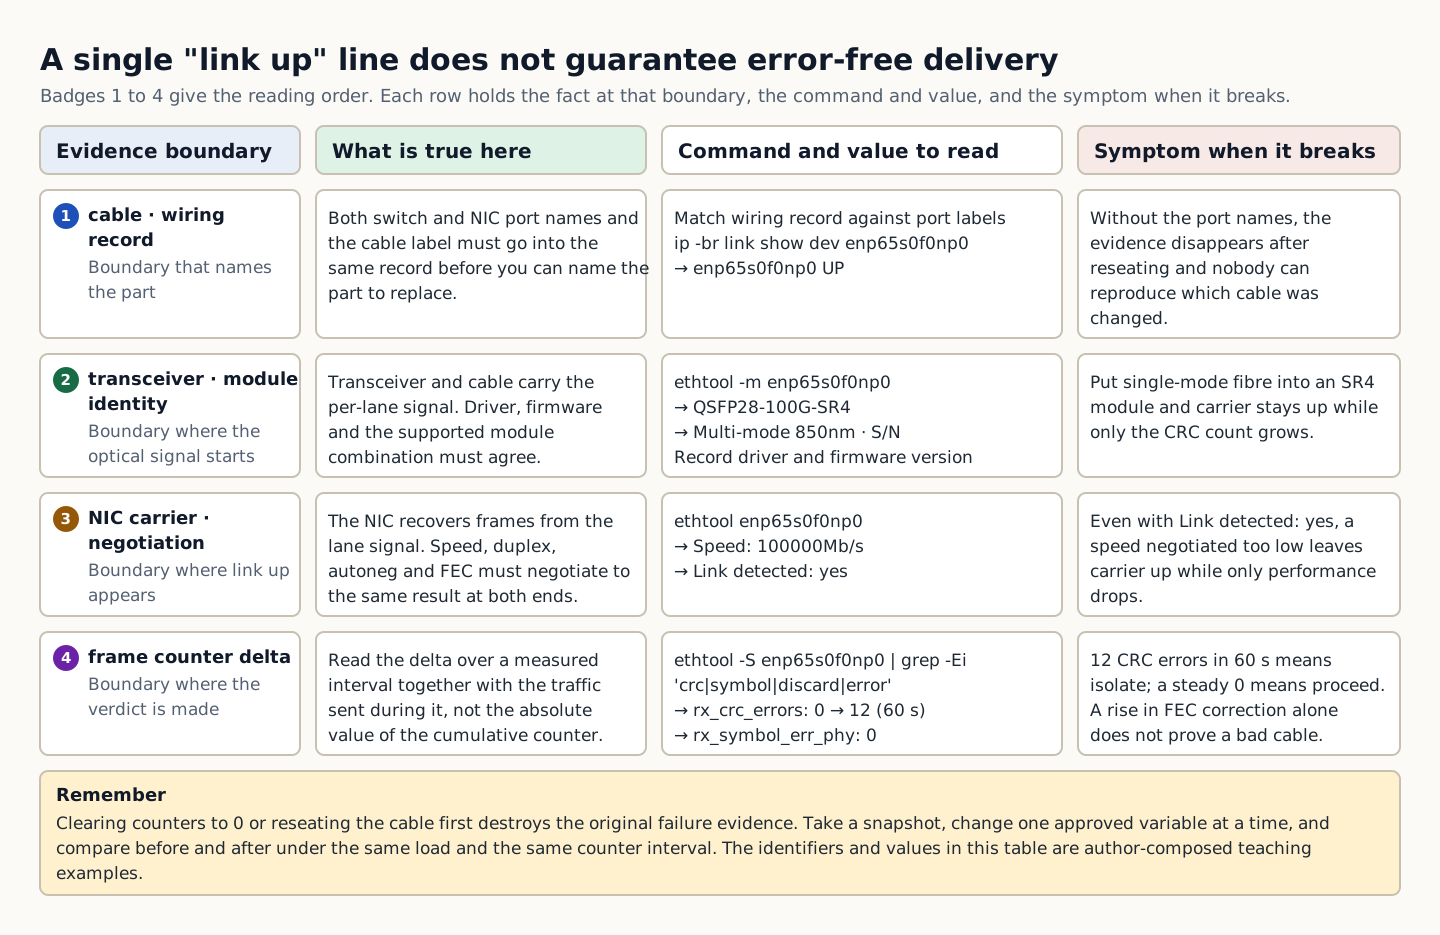
The state in which the interface detects the peer's link signal; it is not a sufficient condition for correct data delivery.

Operational question for this course

How do you accept a reproducible collective path rather than a fast link?

Link the layer-by-layer counters from the physical signal through routing, queues, RDMA and the distributed workload to build the rationale for a cable replacement or a configuration change.

CORE UNIT 2 / 4

Ethernet and switching

Explain the address, VLAN, route, and congestion boundaries.

Difficulty
Intermediate
Structure
Lessons 5 · Labs 2 · Assessment

Diagrams and tables: composed by the author using each lesson's official primary sources. Find the originals and review dates at the end of that lesson.

PREREQUISITE CHECK

Three things to check before reading

This is not a test of memorized answers. Think about each question first, then open the explanation to review the foundational concepts used in this course.

1Does this unit send commands to real equipment?

No. Read the training output in the browser and make the judgment there. Any separate reproduction is done only in an approved isolated environment.

2What permissions and environment must you confirm before the lab?

Network namespace administrator, read-only on the switch. Isolated VLAN 198.51.100.0/24.

3What evidence did you record in the previous unit, "Fundamentals of signals, links, and ports"?

You succeed when you connect the ports at both ends, the module, speed/FEC, and the 10-minute counter increase to reach a verdict of healthy or isolate.

TEXTBOOK GUIDE

Main text that covers each concept from its background to the criteria for judging it

We explain the material section by section so readers new to IT can connect causes and effects without memorizing terms.

  1. Explain the components and failure boundaries of Ethernet and switching with a diagram.
  2. Judge the state of Ethernet and switching from command output and observed values.
  3. Write the stop conditions and recovery evidence for Ethernet and switching into a work record.
Ethernet and switching Lab environment and safety boundaries
Hardware2-port NIC fixture · leaf/spine cabling table
SoftwareUbuntu 24.04·iproute2·ethtool·rdma-core
Required permissionsNetwork namespace administrator, read-only on the switch
NetworkingIsolated VLAN 198.51.100.0/24

Reviewed against official documentation and training output. Commands and performance tests on real hardware are unconfirmed.

Applies to version: Ubuntu Server 24.04 LTS · rdma-core 50.x fixture · Manuscript review date: 2026-09-01

CONCEPT FLOW

How the chapters connect

The chapters are not isolated short answers to memorize. Follow them from left to right to see how each chapter's concepts support the next decision.

  1. 1.Start the check at the host address
  2. 2.Pins down the lab target for L2 forwarding
  3. 3.Distinguishes L3 path output from its meaning
  4. 4.Decides whether the queue results proceed or stop
  5. 5.Re-verify recovery of Ethernet and switching
Ethernet and switching: the overall map. If you lose track while reading the detailed explanations and chapters below, return to this sequence.

CONTROLLED EXPLANATION

Follow the evidence to check, one step at a time

Current explanation · 1/5 · Start the check at the host address

Up next: Pins down the lab target for L2 forwarding

  1. Start the check at the host address

    Do not guess the cause and start by changing settings. If you group the following evidence into records from the same time window, another operator can reproduce the boundary at which the expected state broke.

  2. Pins down the lab target for L2 forwarding

    Lab scenario:: In a fixture where ping within the same subnet works but a remote service does not, find the wrong route. Instructions:: In the browser, read the training output below and write a verdict. Do not send the commands to real equipment. To reproduce the commands separately, prepare an approved isolated environment with the relevant tools and example files. Save the entire output, and if the VLAN, MTU, or gateway does not match, do not move on to the next change.

  3. Distinguishes L3 path output from its meaning

    The point is not to memorize the values themselves but to confirm that source selection, the gateway neighbor, and the path MTU match the design. The values shown are reproduced examples for training, not measurements taken on real equipment. Identifiers and values can differ by device, driver, and cluster.

  4. Decides whether the queue results proceed or stop

    Success means separating the L2 and L3 boundaries and narrowing the failure down to a single layer with the actually selected route and an MTU test. Record the execution time, target identity, commands used, key output, verdict, and next action together in the result.

  5. Re-verify recovery of Ethernet and switching

    If you find a route or VLAN that differs from the design, preserve the pre-change configuration and pass the comparison result to the owner. After the fix, re-verify small packets, path-MTU packets, and a service request in that order. After recovery, measure again with the same commands and the same success criteria. Do not close an incident just because things appear normal.

Conceptual explanation 01

Narrow the Ethernet path from the host address to the switch queue

VLAN (virtual LAN): a configuration that logically divides Ethernet broadcast domains even on the same physical switch.

Ethernet forwarding is a chain of MAC learning, VLAN, IP subnet, route, ARP/ND, and queues. The mere fact that two devices are plugged into the same switch guarantees neither the same broadcast domain nor the ability to communicate.

The host decides whether the destination is on the local subnet, and if it is remote it sends the frame to the gateway MAC. The switch forwards by MAC within the VLAN, and the router crosses subnets. Congestion builds up in the egress queue and produces drops and tail latency.

Before concluding that a communication failure is the firewall's fault, narrow the boundary in the order of local address, route, neighbor, VLAN, and path. Use packet capture only within the minimum scope and the rules for handling sensitive information.

In the training example the sending port transmits tagged frames on VLAN 120 while the receiving port is configured as untagged VLAN 130. Even with both links up and correct IP addresses, this is not the same connection path. Treating a small ping failure as a routing problem right away misses the VLAN boundary underneath. Check port mode, allowed VLANs and MAC learning first, then move up to IP and MTU.

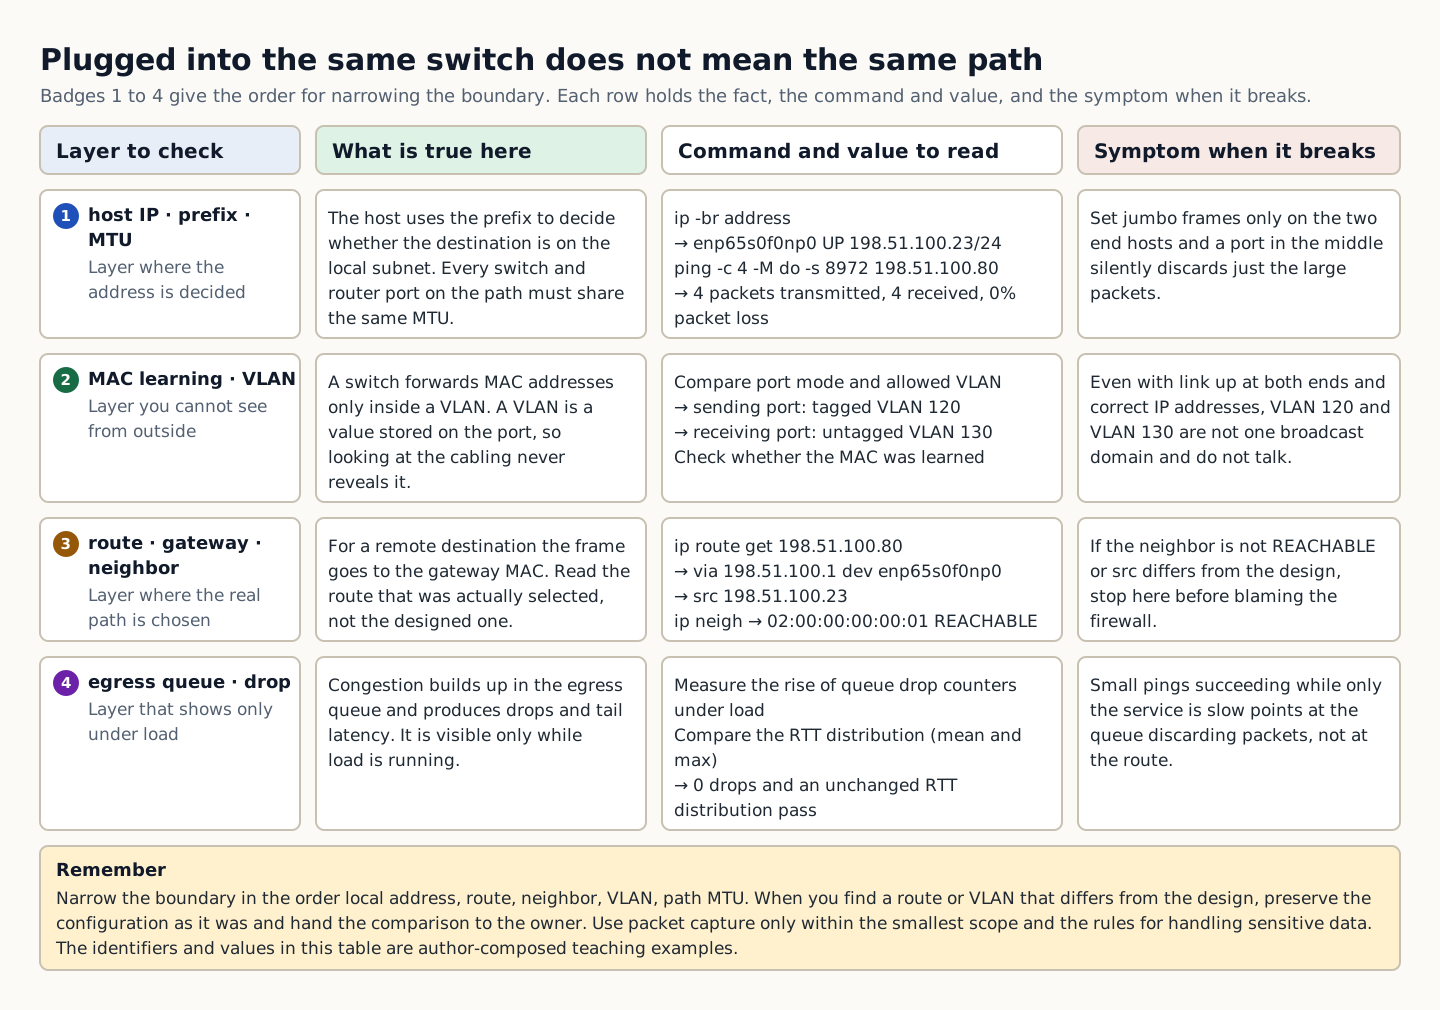
A four-column table giving, for each of four layers (host IP, prefix, and MTU; MAC learning and VLAN; route, gateway, and neighbor; egress queue and drop), what is true there, the command to check it, and the symptom when it does not match
How to read the figure Badges 1 to 4 in the leftmost column give the order for narrowing the boundary, and each row places side by side what is true at that layer, the check command and observed value, and the symptom of a mismatch. In row 1, read `198.51.100.23/24` with `ip -br address` to determine whether the destination is on the local subnet. A result of `0% packet loss` from `ping -c 4 -M do -s 8972` means ICMP round trips with the specified payload size succeeded under those test conditions; it does not prove that every segment of the path has the same MTU. Row 2 covers what cannot be seen by eye: if the sending port is tagged VLAN 120 and the receiving port is untagged VLAN 130, the result may not be the intended broadcast domain even when both links are up and IP addresses are correct, so compare port mode, VLAN mapping, and MAC learning. In row 3, `ip route get` shows the actually selected `via 198.51.100.1` and `src 198.51.100.23`, and even if the neighbor state is not `REACHABLE`, states such as STALE can still be valid entries. Check whether FAILED or INCOMPLETE persists and what the state is on a new request before considering a firewall hypothesis. Row 4 checks drops and the RTT distribution under load. Do not conclude that queue discards are occurring from a successful small ping and service latency alone; compare queue counters, application latency, and load in the same time window. As the summary box at the bottom states, narrow in the order local address → route → neighbor → VLAN → path, and if you find a route or VLAN that differs from the design, preserve the pre-change configuration and pass it to the owner. The figure can be read from badge numbers and column titles alone without distinguishing colors, and the addresses and VLAN numbers in the table are training examples composed by the author. It does not show rack cabling or switch appearance, only the check order and decision criteria. Source: composed by the author based on Linux Networking Documentation · NVIDIA Networking Documentation.
Why does this happen?
The host decides whether the destination is on the local subnet and, if it is remote, sends the frame to the gateway MAC. A switch forwards frames by MAC within a VLAN, and a router carries traffic across subnets. Congestion builds up in egress queues and causes drops and tail latency.
When is it a problem?
If you see a VLAN, MTU, or gateway mismatch, there are insufficient grounds to proceed.
Common beginner misconceptions
Setting jumbo frames on only the two end hosts is not enough. Check that each segment of the path accepts the required frame and packet sizes, and account for encapsulation overhead. Devices may display MTU on different bases, so do not pass a path just because the numbers are the same.
How to verify it yourself
Compare the IP, prefix, and MTU of the source and destination. Check on which interface, and to which MAC, each neighbor entry is resolved.
To summarize this sectionYou succeed when you distinguish the L2 and L3 boundaries and narrow the failure to a single layer using the actually selected route and an MTU test.

CHAPTER 1 / 5

Start the check at the host address

Do not guess the cause and start by changing settings. If you group the following evidence into records from the same time window, another operator can reproduce the boundary at which the expected state broke.

1. Compare the IP, prefix, and MTU of the source and destination. 2. Check which interface the neighbor entry resolves on and to which MAC. 3. Use route get to see the source, gateway and interface actually selected. 4. Measure whether queue drops and the RTT distribution increase under load.

CHAPTER 2 / 5

Pins down the lab target for L2 forwarding

Commands for reproducing the isolated environment · do not run them in the browser
ip -br address
ip route get 198.51.100.80
ip neigh show dev enp65s0f0np0
ping -c 4 -M do -s 8972 198.51.100.80

CHAPTER 3 / 5

Distinguishes L3 path output from its meaning

Expected output for training · not an actual measurement
198.51.100.80 via 198.51.100.1 dev enp65s0f0np0 src 198.51.100.23
198.51.100.1 lladdr 02:00:00:00:00:01 REACHABLE
4 packets transmitted, 4 received, 0% packet loss

CHAPTER 4 / 5

Decides whether the queue results proceed or stop

CHAPTER 5 / 5

Re-verify recovery of Ethernet and switching

CONCRETE CASES

In a fixture where ping within the same subnet works but a remote service does not, find the wrong route.

Before concluding that a communication failure is the firewall's fault, narrow the boundary in the order of local address, route, neighbor, VLAN, and path. Use packet capture only within the minimum scope and the rules for handling sensitive information.

Wrong responses and boundaries to check

Setting jumbo frames on only the two end hosts is not enough. Check that each segment of the path accepts the required frame and packet sizes, including encapsulation overhead. Devices may count MTU differently, so do not pass a path just because the numbers match.

If you find a route or VLAN that differs from the design, preserve the pre-change configuration and pass the comparison result to the owner. After the fix, re-verify small packets, path-MTU packets, and a service request in that order. After recovery, measure again with the same commands and the same success criteria. Do not close an incident just because things appear normal.

INTERACTIVE LAB 1 / 2

Lab 1 · Find the basis for a verdict in the output

Enter values in the browser and check the execution results and the failure and recovery paths. No commands are ever sent to real equipment or the NAS.

Lab scenario:: In a fixture where ping within the same subnet works but a remote service does not, find the wrong route. Instructions:: In the browser, read the training output below and write a verdict. Do not send the commands to real equipment. To reproduce the commands separately, prepare an approved isolated environment with the relevant tools and example files. Save the entire output, and if the VLAN, MTU, or gateway does not match, do not move on to the next change.

198.51.100.80 via 198.51.100.1 dev enp65s0f0np0 src 198.51.100.23
198.51.100.1 lladdr 02:00:00:00:00:01 REACHABLE
4 packets transmitted, 4 received, 0% packet loss

The point is not to memorize the values themselves but to confirm that source selection, the gateway neighbor, and the path MTU match the design. The values shown are reproduced examples for training, not measurements taken on real equipment. Identifiers and values can differ by device, driver, and cluster.

INTERACTIVE LAB 2 / 2

Lab 2 · Plan for stopping and recovery

Enter values in the browser and check the execution results and the failure and recovery paths. No commands are ever sent to real equipment or the NAS.

Setting jumbo frames on only the two end hosts is not enough. Check that each segment of the path accepts the required frame and packet sizes, including encapsulation overhead. Devices may count MTU differently, so do not pass a path just because the numbers match.

KEY TERMS

Key terms in this unit

VLAN (virtual LAN)
A configuration that logically divides Ethernet broadcast domains, even on the same physical switch.

UNIT WORKBOOK

Exercises and worksheets for applying concepts to new situations

Start by checking basic principles, then expand to practical workplace decisions. After submitting an answer, you can see why every option is correct or incorrect, not just the correct answer.

Write the stop conditions and recovery evidence for Ethernet and switching into a work record.

PERSONAL WORKSHEET

A learning worksheet you adapt to your own environment

Your input remains only on the current browser screen and is not stored or transmitted externally. Use categories and pseudonyms instead of actual sensitive information.

OFFICIAL SOURCES

Verify against official sources

Reviewed against official documentation and training output. Commands and performance tests on real hardware are unconfirmed.

CORE UNIT 3 / 4

RDMA and the AI fabric

Judge the conditions for using RDMA and the trade-offs of a lossless design.

Difficulty
Intermediate
Structure
Lessons 5 · Labs 2 · Assessment

Diagrams and tables: composed by the author using each lesson's official primary sources. Find the originals and review dates at the end of that lesson.

PREREQUISITE CHECK

Three things to check before reading

This is not a test of memorized answers. Think about each question first, then open the explanation to review the foundational concepts used in this course.

1Does this unit send commands to real equipment?

No. Read the training output in the browser and make the judgment there. Any separate reproduction is done only in an approved isolated environment.

2What permissions and environment must you confirm before the lab?

Network namespace administrator, read-only on the switch. Isolated VLAN 198.51.100.0/24.

3What evidence did you record in the previous unit, "Ethernet and switching"?

Success means separating the L2 and L3 boundaries and narrowing the failure down to a single layer with the actually selected route and an MTU test.

TEXTBOOK GUIDE

Main text that covers each concept from its background to the criteria for judging it

We explain the material section by section so readers new to IT can connect causes and effects without memorizing terms.

  1. Explain the components and failure boundaries of RDMA and the AI fabric with a diagram.
  2. Judge the state of RDMA and the AI fabric from command output and observed values.
  3. Write the stop conditions and recovery evidence for RDMA and the AI fabric into a work record.
RDMA and the AI fabric Lab environment and safety boundaries
Hardware2-port NIC fixture · leaf/spine cabling table
SoftwareUbuntu 24.04·iproute2·ethtool·rdma-core
Required permissionsNetwork namespace administrator, read-only on the switch
NetworkingIsolated VLAN 198.51.100.0/24

Reviewed against official documentation and training output. Commands and performance tests on real hardware are unconfirmed.

Applies to version: Ubuntu Server 24.04 LTS · rdma-core 50.x fixture · Manuscript review date: 2026-09-01

CONCEPT FLOW

How the chapters connect

The chapters are not isolated short answers to memorize. Follow them from left to right to see how each chapter's concepts support the next decision.

  1. 1.Start the check at the RDMA device
  2. 2.Fix the lab target for the transfer path
  3. 3.Distinguish the output of congestion control from what it means
  4. 4.Make the go/stop decision on the collective
  5. 5.Re-verify recovery of RDMA and the AI fabric
RDMA and the AI fabric: the overall map. If you lose track while reading the detailed explanations and chapters below, return to this sequence.

CONTROLLED EXPLANATION

Follow the evidence to check, one step at a time

Current explanation · 1/5 · Start the check at the RDMA device

Up next: Fix the lab target for the transfer path

  1. Start the check at the RDMA device

    Do not guess the cause and start by changing settings. If you group the following evidence into records from the same time window, another operator can reproduce the boundary at which the expected state broke.

  2. Fix the lab target for the transfer path

    Lab scenario:: In an isolated two-node fixture, review the RDMA device mapping and the performance test conditions. Instructions:: In the browser, read the training output below and write a verdict. Do not send the commands to real equipment. To reproduce the commands separately, prepare an approved isolated environment with the relevant tools and example files. Save the entire output, and if retries, pause frames, or tail latency surge, do not move on to the next change.

  3. Distinguish the output of congestion control from what it means

    The point is not to memorize the values themselves but to confirm that the RDMA port to netdev mapping is correct and that the target bandwidth is reproducible under the stated conditions. The values shown are reproduced examples for training, not measurements taken on real equipment. Identifiers and values can differ by device, driver, and cluster.

  4. Make the go/stop decision on the collective

    Success means producing a test table that includes device, GID, message size, duration, average and minimum bandwidth, and error counters. Record the execution time, target identity, commands used, key output, verdict, and next action together in the result.

  5. Re-verify recovery of RDMA and the AI fabric

    If performance is low, first check the link, NUMA and PCIe mapping, and a single flow. Do not change PFC and ECN at the same time; after one change, re-measure the counters on both the host and the switch. After recovery, measure again with the same commands and the same success criteria. Do not close an incident just because things appear normal.

Conceptual explanation 01

Link the conditions from the RDMA device up to collective performance

RDMA (Remote Direct Memory Access): a method of delivering data into remote memory through a supported NIC and transport.

Remote Direct Memory Access (RDMA) reduces the involvement of the CPU and the kernel data path in transfers to remote memory, but it does not automatically make the network fast and lossless.

The RDMA device, GID, queue pair, and memory registration must all match, and RoCE is operated together with the loss and congestion design of the Ethernet network. Overusing Priority Flow Control (PFC) creates new failure modes: head-of-line blocking and pause storms.

Split the functional check into three stages: the device is visible, small messages get through, and bandwidth, latency and retries are acceptable at the target message size and concurrency.

In the training example, the ordinary TCP test passed, but the RDMA test could not establish a connection. Working TCP communication does not prove the RDMA device, GID, or queue pair configuration. For RoCE, investigate the IP, GID, MTU, and congestion control path; for InfiniBand, investigate the state of that fabric's management separately. Do not treat the configuration of the two transports as a single common command.

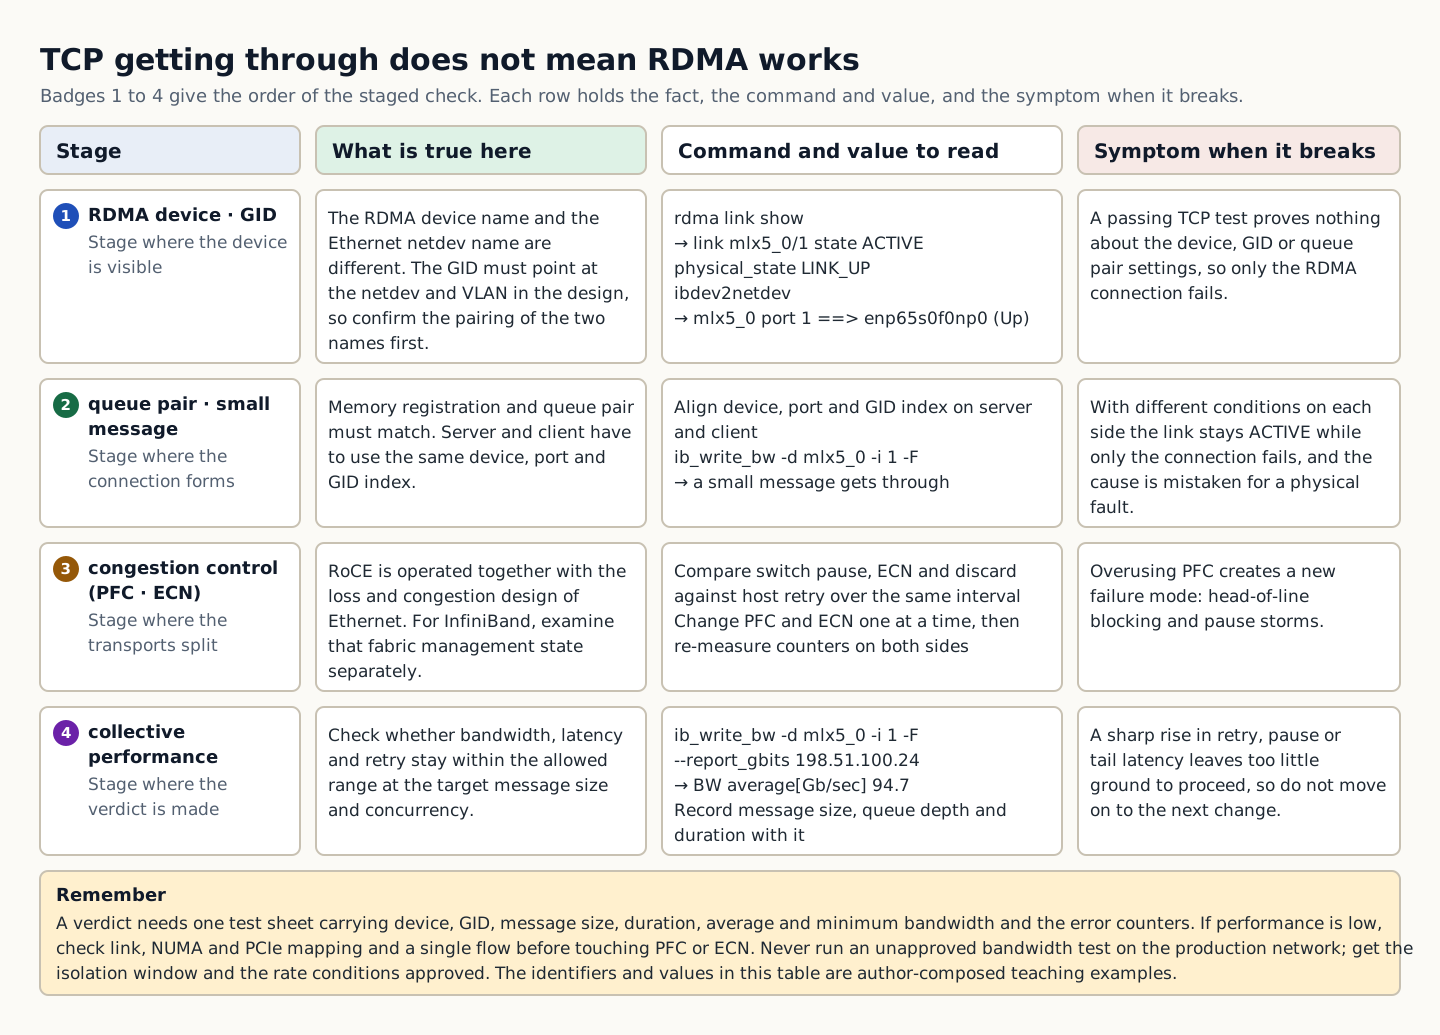
A four-column table giving, for each of four stages (RDMA device and GID, queue pair, congestion control, and collective performance), what is true there, the command to check it, and the symptom when it does not match
How to read the figure Badges 1 to 4 in the leftmost column give the order for checking functions one stage at a time, and each row places side by side what is true at that stage, the check command and observed value, and the symptom of a mismatch. In row 1, `mlx5_0/1 state ACTIVE` from `rdma link show` and `mlx5_0 port 1 ==> enp65s0f0np0` from `ibdev2netdev` show how the RDMA device name pairs with the Ethernet netdev name; a passing TCP test proves neither this pairing nor the GID. Row 2 is where the connection is established: if the server and client do not use the same device, port, and GID index, the link is ACTIVE but the connection still fails. Row 3 is where the transports diverge: RoCE is examined together with Ethernet's loss and congestion design, while InfiniBand requires a separate check of its fabric management state. Overusing PFC creates new failure modes (head-of-line blocking and pause storms), so change only one of PFC and ECN at a time and re-measure the counters on both the host and the switch. Row 4 is where the verdict is decided: check whether a value such as `BW average[Gb/sec] 94.7` is reproduced under the stated conditions, and do not move on to the next change if retries, pauses, or tail latency rise sharply. The figure can be read from badge numbers and column titles alone without distinguishing colors, and the identifiers and numbers in the table are training examples composed by the author. It does not show what an HCA card looks like or a fabric cabling diagram, only the check order and decision criteria. Source: composed by the author based on NVIDIA Networking Documentation · Linux Networking Documentation.
Why does this happen?
The RDMA device, GID, queue pairs, and memory registration must all be correct, and RoCE must be operated together with Ethernet loss and congestion design. Overusing Priority Flow Control (PFC) introduces new failure modes: head-of-line blocking and pause storms.
When is it a problem?
If retries, pause frames, or tail latency surge, there are insufficient grounds to proceed.
Common beginner misconceptions
Running an unauthorized bandwidth test on the production network affects real workloads and switch queues. Get approval for an isolated window and rate limits.
How to verify it yourself
Check that the rdma link and GID point to the designed netdev and VLAN. Make sure the server and client use the same device, port, and GID index.
To summarize this sectionYou succeed when you write a test table that includes the device, GID, message size, duration, average and minimum bandwidth, and error counters.

CHAPTER 1 / 5

Start the check at the RDMA device

Do not guess the cause and start by changing settings. If you group the following evidence into records from the same time window, another operator can reproduce the boundary at which the expected state broke.

1. Check whether the rdma link and GID point to the intended netdev and VLAN. 2. Make sure server and client use the same device, port, and GID index conditions. 3. Record the message size, queue depth, and duration of the perftest. 4. Compare switch pause, ECN, and discards with host retries in the same time window.

CHAPTER 2 / 5

Fix the lab target for the transfer path

Commands for reproducing the isolated environment · do not run them in the browser
rdma link show
ibdev2netdev
ib_write_bw -d mlx5_0 -i 1 -F --report_gbits 198.51.100.24

CHAPTER 3 / 5

Distinguish the output of congestion control from what it means

Expected output for training · not an actual measurement
link mlx5_0/1 state ACTIVE physical_state LINK_UP netdev enp65s0f0np0
mlx5_0 port 1 ==> enp65s0f0np0 (Up)
BW average[Gb/sec] 94.7

CHAPTER 4 / 5

Make the go/stop decision on the collective

CHAPTER 5 / 5

Re-verify recovery of RDMA and the AI fabric

CONCRETE CASES

In an isolated two-node fixture, review the RDMA device mapping and the performance test conditions.

Split the functional check into three stages: the device is visible, small messages get through, and bandwidth, latency and retries are acceptable at the target message size and concurrency.

Wrong responses and boundaries to check

Running an unauthorized bandwidth test on the production network affects real workloads and switch queues. Get approval for an isolated window and rate limits.

If performance is low, first check the link, NUMA and PCIe mapping, and a single flow. Do not change PFC and ECN at the same time; after one change, re-measure the counters on both the host and the switch. After recovery, measure again with the same commands and the same success criteria. Do not close an incident just because things appear normal.

INTERACTIVE LAB 1 / 2

Lab 1 · Find the basis for a verdict in the output

Enter values in the browser and check the execution results and the failure and recovery paths. No commands are ever sent to real equipment or the NAS.

Lab scenario:: In an isolated two-node fixture, review the RDMA device mapping and the performance test conditions. Instructions:: In the browser, read the training output below and write a verdict. Do not send the commands to real equipment. To reproduce the commands separately, prepare an approved isolated environment with the relevant tools and example files. Save the entire output, and if retries, pause frames, or tail latency surge, do not move on to the next change.

link mlx5_0/1 state ACTIVE physical_state LINK_UP netdev enp65s0f0np0
mlx5_0 port 1 ==> enp65s0f0np0 (Up)
BW average[Gb/sec] 94.7

The point is not to memorize the values themselves but to confirm that the RDMA port to netdev mapping is correct and that the target bandwidth is reproducible under the stated conditions. The values shown are reproduced examples for training, not measurements taken on real equipment. Identifiers and values can differ by device, driver, and cluster.

INTERACTIVE LAB 2 / 2

Lab 2 · Plan for stopping and recovery

Enter values in the browser and check the execution results and the failure and recovery paths. No commands are ever sent to real equipment or the NAS.

Running an unauthorized bandwidth test on the production network affects real workloads and switch queues. Get approval for an isolated window and rate limits.

KEY TERMS

Key terms in this unit

RDMA (Remote Direct Memory Access)
A method of transferring data to remote memory through a supported NIC and transport.

UNIT WORKBOOK

Exercises and worksheets for applying concepts to new situations

Start by checking basic principles, then expand to practical workplace decisions. After submitting an answer, you can see why every option is correct or incorrect, not just the correct answer.

Write the stop conditions and recovery evidence for RDMA and the AI fabric into a work record.

PERSONAL WORKSHEET

A learning worksheet you adapt to your own environment

Your input remains only on the current browser screen and is not stored or transmitted externally. Use categories and pseudonyms instead of actual sensitive information.

OFFICIAL SOURCES

Verify against official sources

Reviewed against official documentation and training output. Commands and performance tests on real hardware are unconfirmed.

CORE UNIT 4 / 4

Cabling and fabric acceptance testing

Decide Go/No-Go from the cabling table, the link state, the throughput and the error counters.

Difficulty
Intermediate
Structure
Lessons 5 · Labs 2 · Assessment

Diagrams and tables: composed by the author using each lesson's official primary sources. Find the originals and review dates at the end of that lesson.

PREREQUISITE CHECK

Three things to check before reading

This is not a test of memorized answers. Think about each question first, then open the explanation to review the foundational concepts used in this course.

1Does this unit send commands to real equipment?

No. Read the training output in the browser and make the judgment there. Any separate reproduction is done only in an approved isolated environment.

2What permissions and environment must you confirm before the lab?

Network namespace administrator, read-only on the switch. Isolated VLAN 198.51.100.0/24.

3What evidence did you record in the previous unit, "RDMA and the AI fabric"?

Success means producing a test table that includes device, GID, message size, duration, average and minimum bandwidth, and error counters.

TEXTBOOK GUIDE

Main text that covers each concept from its background to the criteria for judging it

We explain the material section by section so readers new to IT can connect causes and effects without memorizing terms.

  1. Explain the components and failure boundaries of cabling and fabric acceptance testing using a diagram.
  2. Judge the state of cabling and fabric acceptance testing from command output and observed values.
  3. Document the stop conditions and recovery evidence for cabling and fabric acceptance testing in a work record.
Cabling and fabric acceptance testing Lab environment and safety boundaries
Hardware2-port NIC fixture · leaf/spine cabling table
SoftwareUbuntu 24.04·iproute2·ethtool·rdma-core
Required permissionsNetwork namespace administrator, read-only on the switch
NetworkingIsolated VLAN 198.51.100.0/24

Reviewed against official documentation and training output. Commands and performance tests on real hardware are unconfirmed.

Applies to version: Ubuntu Server 24.04 LTS · rdma-core 50.x fixture · Manuscript review date: 2026-09-01

CONCEPT FLOW

How the chapters connect

The chapters are not isolated short answers to memorize. Follow them from left to right to see how each chapter's concepts support the next decision.

  1. 1.Start the check at the inventory
  2. 2.Fix the lab target for a single link
  3. 3.Distinguish the output of the whole fabric from what it means
  4. 4.Make the go/stop decision on the acceptance verdict
  5. 5.Re-verify recovery for cabling and fabric acceptance testing
Cabling and fabric acceptance testing: the overall map. If you lose track while reading the detailed explanations and chapters below, return to this sequence.

CONTROLLED EXPLANATION

Follow the evidence to check, one step at a time

Current explanation · 1/5 · Start the check at the inventory

Up next: Fix the lab target for a single link

  1. Start the check at the inventory

    Do not guess the cause and start by changing settings. If you group the following evidence into records from the same time window, another operator can reproduce the boundary at which the expected state broke.

  2. Fix the lab target for a single link

    Lab scenario:: In the 8-node acceptance fixture, judge as No-Go a result in which the average passes but one node is 18% slower, and build the evidence package. Instructions:: In the browser, read the training output below and write a verdict. Do not send the commands to real equipment. To reproduce the commands separately, prepare an approved isolated environment with the relevant tools and example files. Save the entire output, and if you see node-to-node variation, link flaps, or rising errors, do not move on to the next change.

  3. Distinguish the output of the whole fabric from what it means

    The point is not to memorize the values themselves but to confirm that, on a topology at the same revision, the per-node collective results and error deltas are within the acceptance criteria. The values shown are reproduced examples for training, not measurements taken on real equipment. Identifiers and values can differ by device, driver, and cluster.

  4. Make the go/stop decision on the acceptance verdict

    The task is complete when you submit a Go/No-Go table containing each node's inventory, P50/P95 bandwidth, maximum deviation, error delta, and retest conditions. Record the execution time, target identity, commands used, key output, verdict, and next action together in the result.

  5. Re-verify recovery for cabling and fabric acceptance testing

    Isolate the outlier node and narrow the boundary in the order cable, port, NUMA, PCIe, firmware. After changing the cause, re-run the whole matrix at the same revision. After recovery, measure again with the same commands and the same success criteria. Do not close an incident just because things appear normal.

Conceptual explanation 01

Fabric acceptance proceeds step by step from inventory to collectives

Collective (collective communication): a data exchange operation that multiple ranks perform together in a fixed order.

Fabric acceptance is not a single top-speed run; it is the process of approving inventory completeness, path symmetry, error-free sustained load, per-node variation, and recoverability.

A collective workload is limited by its slowest participant and by barriers. Even if the average exceeds the target, tail latency on one node, incorrect NUMA placement, flaps, or corrected errors will delay the entire job in production.

The test matrix must include cable/port identity, firmware, topology, message size, the number of concurrent jobs, the measurement duration, and the allowed variation. Record the revision and hash of each result file.

In the training example, 7 of the 8 ranks are healthy, but one rank's communication time has increased. Even if the average bandwidth exceeds the target, the whole job can slow down at the point where every rank waits. Tie the per-rank transport and path, along with the per-message-size results, to the same run ID. Checking whether the problem follows the slow rank when you move it lets you distinguish the node hypothesis from the path hypothesis.

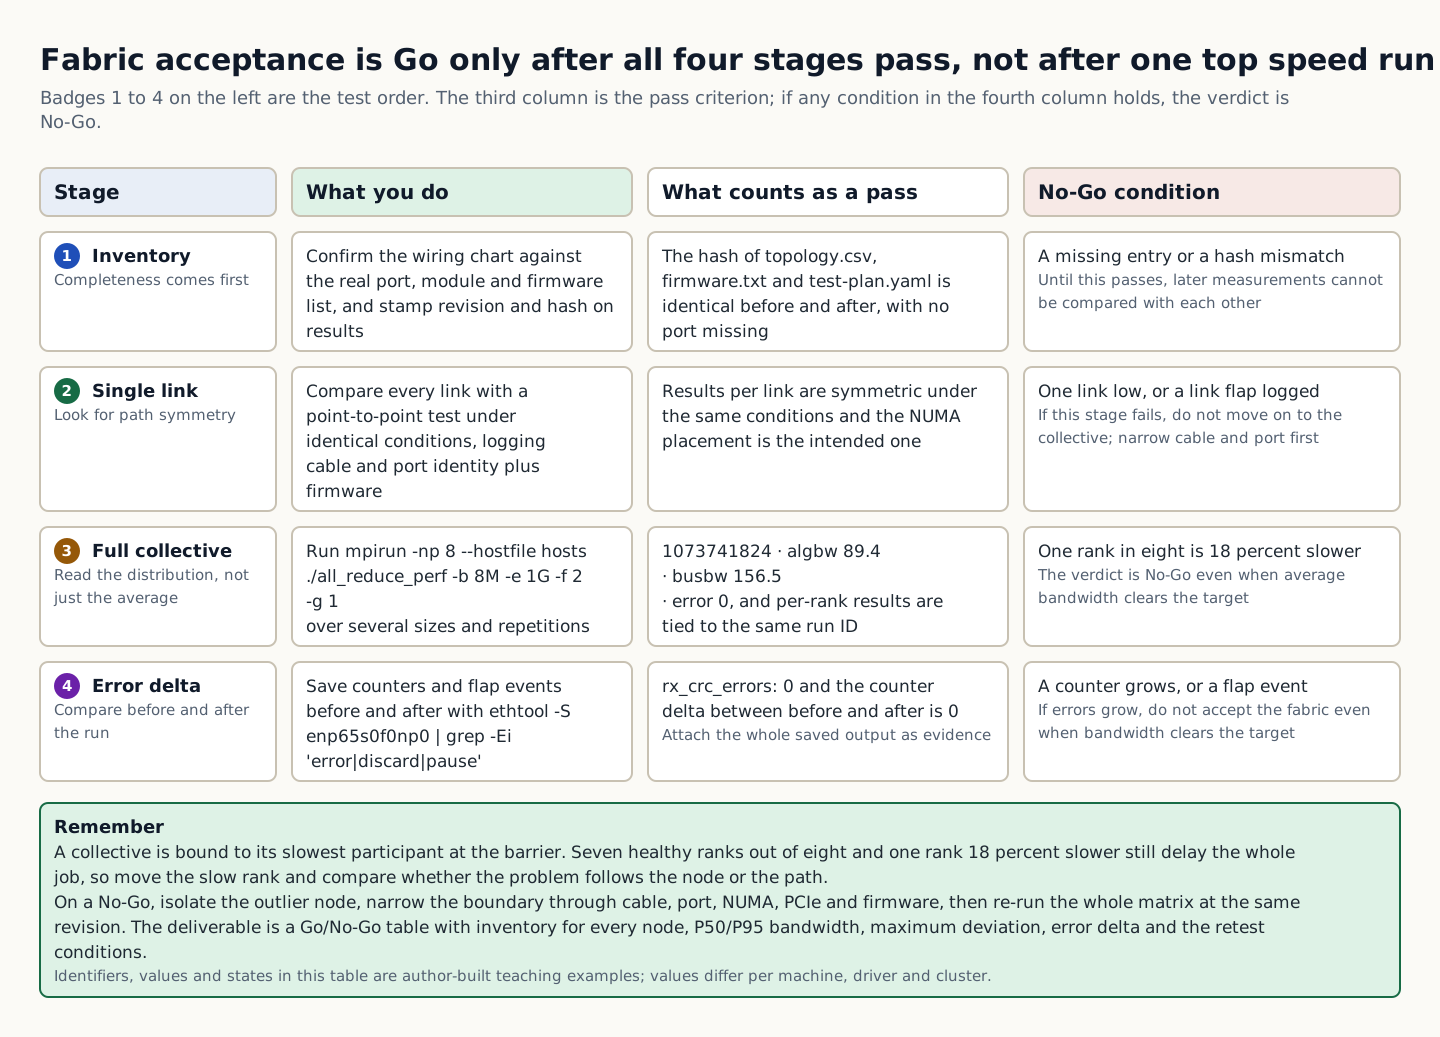
A fabric acceptance verdict table that splits four stages (inventory, single link, full collective, and error delta) into pass criteria and No-Go conditions
How to read the figure Badges 1 to 4 on the left give the test order, and each row is one stage: inventory, single link, full collective, and error delta. The third column is the pass criterion, and if any No-Go condition in the fourth column applies, the overall verdict is No-Go. 1073741824 · algbw 89.4 · busbw 156.5 · error 0 in row 3 and rx_crc_errors: 0 in row 4 are training example values composed by the author and vary by hardware, driver, and cluster. The No-Go cell in row 3 is the key point of this unit: if 1 of 8 ranks is 18% slower, the verdict is No-Go even when the average bandwidth exceeds the target. As the green summary box at the bottom states, a collective is bound by the barrier of its slowest participant, so isolate the outlier node, narrow the boundary in the order cable, port, NUMA, PCIe, and firmware, and then rerun the full matrix at the same revision. The table shows the acceptance stages and decision criteria; it does not depict the actual cabling topology. Source: composed by the author based on NVIDIA Networking Documentation · NVIDIA nccl-tests.
Why does this happen?
A collective workload is limited by its slowest participant and by barriers. Even if the average exceeds the target, tail latency on one node, incorrect NUMA placement, flaps, or corrected errors will delay the entire job in production.
When is it a problem?
If you see node-to-node variation, link flaps, or rising errors, there are insufficient grounds to proceed.
Common beginner misconceptions
If you approve a slow node by burying it in the average, the collective's barrier slows down the entire real job. An outlier needs its own cause analysis and retest.
How to verify it yourself
Check that the cabling sheet and the actual port, module, and firmware lists are complete. Compare each link with a point-to-point test under identical conditions.
To summarize this sectionYou succeed when you submit a Go/No-Go table containing the inventory of every node, P50/P95 bandwidth, the maximum variance, the error delta, and the retest conditions.

CHAPTER 1 / 5

Start the check at the inventory

Do not guess the cause and start by changing settings. If you group the following evidence into records from the same time window, another operator can reproduce the boundary at which the expected state broke.

1. Verify that the cabling table and the actual port, module, and firmware lists are complete. 2. Compare each link with a point-to-point test under identical conditions. 3. Run a representative collective at several sizes and repetition counts to obtain the distribution. 4. Store the error counter delta and any flap events from before and after the test.

CHAPTER 2 / 5

Fix the lab target for a single link

Commands for reproducing the isolated environment · do not run them in the browser
sha256sum topology.csv firmware.txt test-plan.yaml
mpirun -np 8 --hostfile hosts ./all_reduce_perf -b 8M -e 1G -f 2 -g 1
ethtool -S enp65s0f0np0 | grep -Ei 'error|discard|pause'

CHAPTER 3 / 5

Distinguish the output of the whole fabric from what it means

Expected output for training · not an actual measurement
<hash>  topology.csv
# size count type redop root time algbw busbw error
1073741824 ... 89.4 156.5 0
rx_crc_errors: 0

CHAPTER 4 / 5

Make the go/stop decision on the acceptance verdict

CHAPTER 5 / 5

Re-verify recovery for cabling and fabric acceptance testing

CONCRETE CASES

In the 8-node acceptance fixture, the average passes but one node is 18% slower; judge the result No-Go and build the evidence package.

The test matrix must include cable/port identity, firmware, topology, message size, the number of concurrent jobs, the measurement duration, and the allowed variation. Record the revision and hash of each result file.

Wrong responses and boundaries to check

Approving a slow node by burying it in the average slows down the entire job because of the collective's barrier. An outlier needs its own cause analysis and retest.

Isolate the outlier node and narrow the boundary in the order cable, port, NUMA, PCIe, firmware. After changing the cause, re-run the whole matrix at the same revision. After recovery, measure again with the same commands and the same success criteria. Do not close an incident just because things appear normal.

INTERACTIVE LAB 1 / 2

Lab 1 · Find the basis for a verdict in the output

Enter values in the browser and check the execution results and the failure and recovery paths. No commands are ever sent to real equipment or the NAS.

Lab scenario:: In the 8-node acceptance fixture, judge as No-Go a result in which the average passes but one node is 18% slower, and build the evidence package. Instructions:: In the browser, read the training output below and write a verdict. Do not send the commands to real equipment. To reproduce the commands separately, prepare an approved isolated environment with the relevant tools and example files. Save the entire output, and if you see node-to-node variation, link flaps, or rising errors, do not move on to the next change.

<hash>  topology.csv
# size count type redop root time algbw busbw error
1073741824 ... 89.4 156.5 0
rx_crc_errors: 0

The point is not to memorize the values themselves but to confirm that, on a topology at the same revision, the per-node collective results and error deltas are within the acceptance criteria. The values shown are reproduced examples for training, not measurements taken on real equipment. Identifiers and values can differ by device, driver, and cluster.

INTERACTIVE LAB 2 / 2

Lab 2 · Plan for stopping and recovery

Enter values in the browser and check the execution results and the failure and recovery paths. No commands are ever sent to real equipment or the NAS.

Approving a slow node by burying it in the average slows down the entire job because of the collective's barrier. An outlier needs its own cause analysis and retest.

KEY TERMS

Key terms in this unit

Collective (collective communication)
A data exchange operation that multiple ranks perform together in a fixed order.

UNIT WORKBOOK

Exercises and worksheets for applying concepts to new situations

Start by checking basic principles, then expand to practical workplace decisions. After submitting an answer, you can see why every option is correct or incorrect, not just the correct answer.

Document the stop conditions and recovery evidence for cabling and fabric acceptance testing in a work record.

PERSONAL WORKSHEET

A learning worksheet you adapt to your own environment

Your input remains only on the current browser screen and is not stored or transmitted externally. Use categories and pseudonyms instead of actual sensitive information.

OFFICIAL SOURCES

Verify against official sources

Reviewed against official documentation and training output. Commands and performance tests on real hardware are unconfirmed.

DECISION ACTIVITY

Among 8 nodes, only one node has low RDMA throughput and rising symbol errors. What is your first action?

First write down the evidence you need and the stop criteria, then choose a verdict.

Choose an answer

THREE-LEVEL ASSESSMENT

From basic principles to operational decisions

When you submit an answer you can see why every option is right or wrong.

Basic Question 1

What does carrier being up not guarantee?

Choose an answer
Apply Question 2

Which test is appropriate for finding an MTU mismatch?

Choose an answer
Capstone Question 3

Why is average bandwidth alone not enough for fabric acceptance?

Choose an answer

LEARNING RECORD

Have you reviewed the text, decision activities, and all explanations?

Completion status is stored only in this browser.