KoreaDevKNOWLEDGE SHARING

Content typeLearn

AI INFRASTRUCTURE · 10 / 12

Observability and incident response

Link the user SLO to metrics, logs, traces and events, and carry out evidence-first incident response and a postmortem.

Difficulty
Intermediate
Structure
Core units 4 · Judgment activities · Three-stage assessment

NEW HIRE ONBOARDING

Start in the order you would receive your first assignment

So that even a new hire with no prior IT background can follow along, we start with the situation, the task, the evidence, and when to report, before difficult definitions.

  1. 01

    Read the situation in one sentence

    Separate the questions that metrics, logs, and traces answer, then link them by the same service, revision, and time. Record the response actions and the re-verification results rather than the number of alerts.

  2. 02

    Today's assignment

    Write the stop conditions and recovery evidence for Incident response and postmortem into a work record.

  3. 03

    Evidence that shows the work is complete

    Reviewed against official documentation and training output. Commands and performance tests on real hardware are unconfirmed.

  4. 04

    When to stop and ask a senior colleague

    GPU utilization is normal, but p99 user response time has doubled. What do you do first?

Unpack unfamiliar terms first

Trace context
The identifying information that carries the trace and span relationships between services.

Operational question for this course

How do you trace a single alert through user impact to recovery evidence?

Separate the questions that metrics, logs, and traces answer, then link them by the same service, revision, and time. Record the response actions and the re-verification results rather than the number of alerts.

CORE UNIT 1 / 4

Observability signals and shared context

Distinguish the questions that metrics, logs, traces, and events answer.

Difficulty
Intermediate
Structure
Lessons 5 · Labs 2 · Assessment

Diagrams and tables: composed by the author using each lesson's official primary sources. Find the originals and review dates at the end of that lesson.

PREREQUISITE CHECK

Three things to check before reading

This is not a test of memorized answers. Think about each question first, then open the explanation to review the foundational concepts used in this course.

1Does this unit send commands to real equipment?

No. Read the training output in the browser and make the judgment there. Any separate reproduction is done only in an approved isolated environment.

2What permissions and environment must you confirm before the lab?

Provided records are read-only · no access to production collectors. Example addresses are for documentation only; do not send real requests to them.

3How do you record a value you have never seen before and a test you have not yet run?

Record it as unconfirmed. Distinguish expected training output from actual measurements, and do not fill in blanks with unapproved work.

TEXTBOOK GUIDE

Main text that covers each concept from its background to the criteria for judging it

We explain the material section by section so readers new to IT can connect causes and effects without memorizing terms.

  1. Explain the components and failure boundaries of observability signals and shared context using a diagram.
  2. Judge the state of observability signals and shared context from command output and observed values.
  3. Document the stop conditions and recovery evidence for observability signals and shared context in a work record.
Observability signals and shared context Lab environment and safety boundaries
HardwareA browser fixture of signal and incident records
SoftwarePrometheus HTTP API v1·OpenTelemetry W3C trace context
Required permissionsProvided records are read-only · no access to production collectors
NetworkingThe example addresses are for documentation only; do not send real requests

Reviewed against official documentation and training output. Commands and performance tests on real hardware are unconfirmed.

Applies to version: Prometheus HTTP API v1 · W3C Trace Context version 00 header · Manuscript review date: 2026-09-01

CONCEPT FLOW

How the chapters connect

The chapters are not isolated short answers to memorize. Follow them from left to right to see how each chapter's concepts support the next decision.

  1. 1.Start the check at the gateway
  2. 2.Pins down the lab target for context propagation
  3. 3.Distinguishes runtime output from its meaning
  4. 4.Decide whether to proceed or stop at the missing window
  5. 5.Re-verify recovery for observability signals and shared context
Observability signals and shared context: the overall map. If you lose track while reading the detailed explanations and chapters below, return to this sequence.

CONTROLLED EXPLANATION

Follow the evidence to check, one step at a time

Current explanation · 1/5 · Start the check at the gateway

Up next: Pins down the lab target for context propagation

  1. Start the check at the gateway

    Do not guess the cause and start by changing settings. If you group the following evidence into records from the same time window, another operator can reproduce the boundary at which the expected state broke.

  2. Pins down the lab target for context propagation

    Lab scenario:: Read the two example logs below and write down whether they belong to the same request and what evidence would break down the 330 ms further. The commands are a reference for querying the same fields in an isolated environment; in the browser, you only read the output. Instructions:: In the browser, read the training output below and write a verdict. Do not send the commands to real equipment. To reproduce the commands separately, prepare an approved isolated environment with the relevant tools and example files. Save the entire output, and if clocks disagree or the context is broken, do not move on to the next change.

  3. Distinguishes runtime output from its meaning

    The point is not to memorize the values themselves but to confirm that the trace IDs match, the parent relationship holds, and time outside the observed scope is recorded separately. The values shown are reproduced examples for training, not measurements taken on real equipment. Identifiers and values can differ by device, driver, and cluster.

  4. Decide whether to proceed or stop at the missing window

    You succeed when you write down two pieces of evidence that link the requests, note the unobserved window, and explain the order for checking the queue span and clocks. Record the execution time, target identity, commands used, key output, verdict, and next action together in the result.

  5. Re-verify recovery for observability signals and shared context

    Once you find the boundary where the context is broken, verify header propagation for the test request and the instrumentation settings in an isolated environment. After the fix, send the same request again and confirm both the span relationships and the absence of personal data. After recovery, measure again with the same commands and the same success criteria. Do not close an incident just because things appear normal.

Conceptual explanation 01

Group the records of the same request to find the slow segment

Trace context: the identifying information that carries the trace and span relationships between services.

Metrics show values and distributions over a period, logs show individual events, and traces show the operations within one request. A low CPU figure alone does not show that requests were fast, because the three kinds of data have different units of observation.

When the service that receives a request passes the trace context to the next service, the parent-child relationships between spans can be reconstructed. If propagation breaks, downstream work appears as a separate trace, and total latency may be split incorrectly. The service name and deployment revision identify which code produced each record.

In the training example, the gateway responded after 420 ms, while the runtime span is 90 ms. You cannot immediately conclude that the remaining 330 ms is network delay. First check queue waiting, serialization, missing spans, and clock differences.

Read the two example logs below and write down whether they belong to the same request and what evidence would break down the 330ms further. The commands are a reference for querying the same fields in an isolated environment; in the browser, you only read the output.
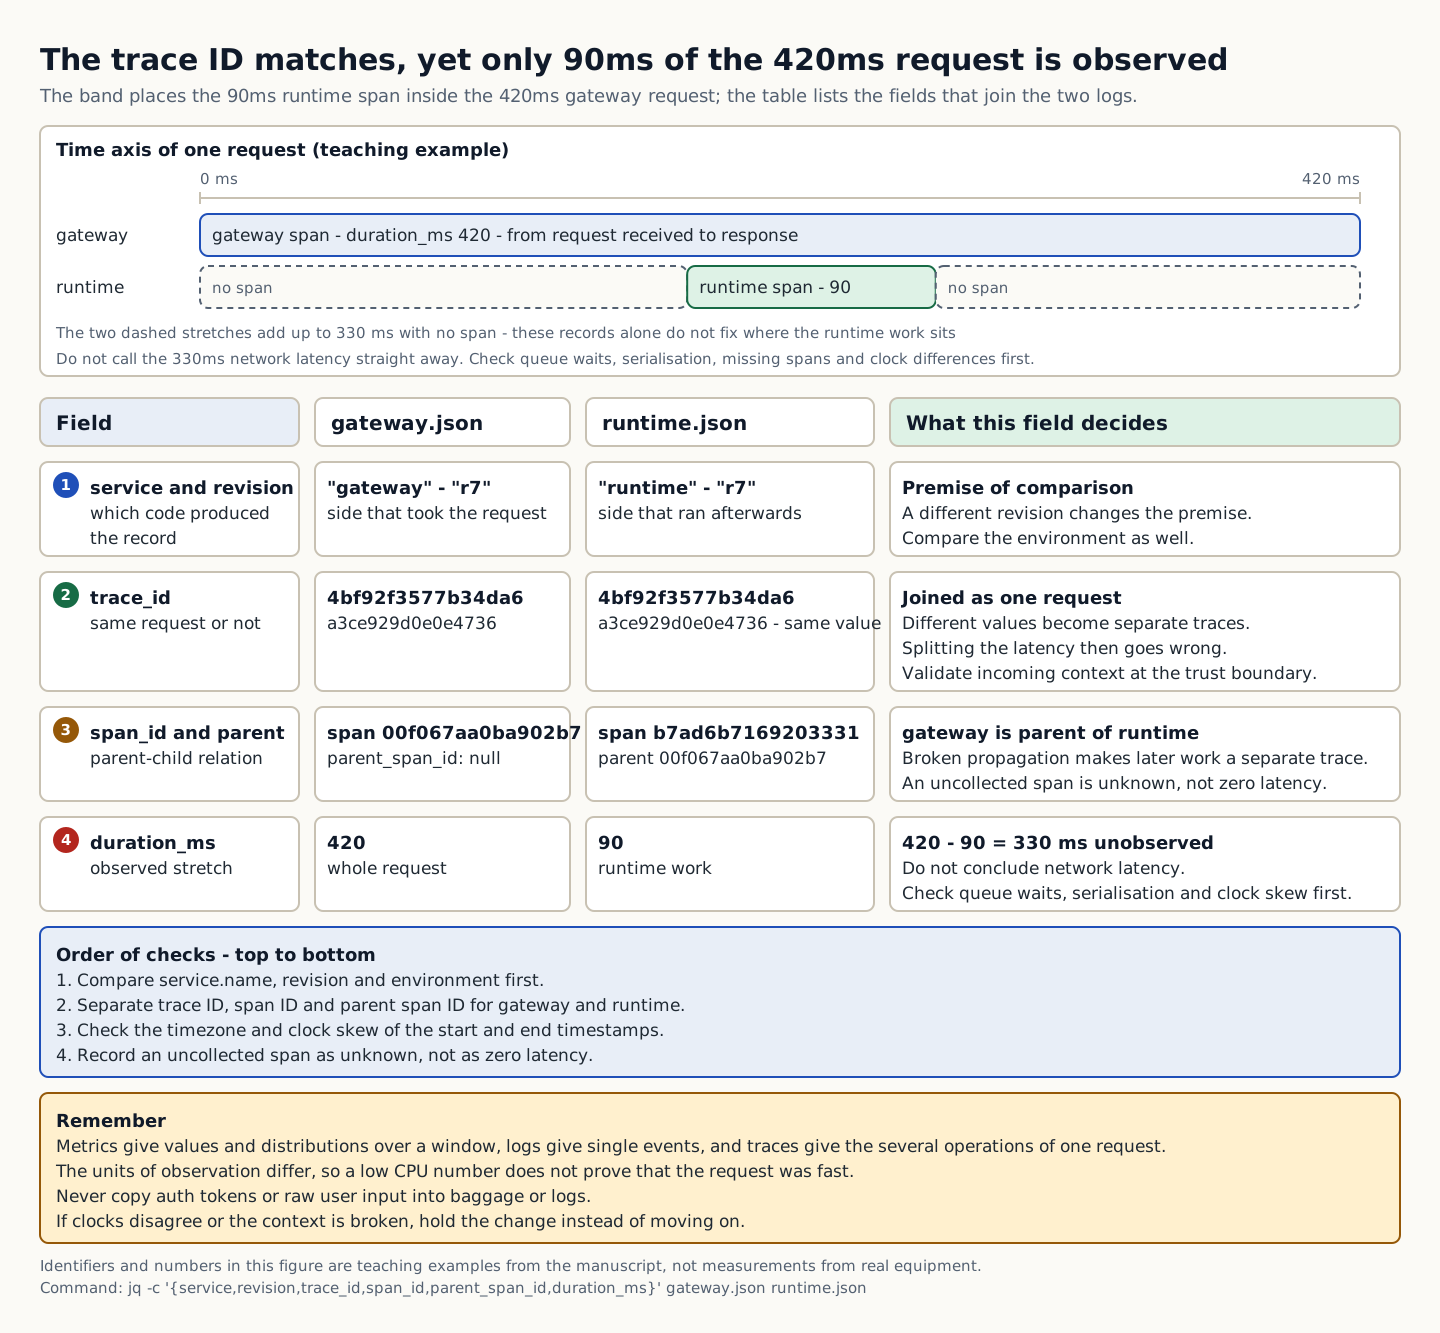
A time axis and field table that link a 90ms runtime span inside a 420ms gateway request by the same trace ID and mark the remaining 330ms as unobserved.
How to read the figure Group the records of one request to find where the latency occurs. The timeline at the top shows where the observed 90ms runtime span sits within the 420ms gateway span; the two dashed segments, totaling 330ms, have no span. These records alone do not determine where the dashed segments fall, so the figure shows only the size of the observed segments and does not assert the actual order of execution. The table below has four columns (field, gateway.json, runtime.json, and verdict) and is read from row 1 to row 4, top to bottom. When the trace IDs match and the runtime's parent span ID equals the gateway's span ID, the two records belong to one request. The 330ms left after subtracting 90 from duration_ms 420 is unobserved; do not conclude it is network latency, and first check queue waiting, serialization, missing spans, and clock differences. Follow the checks in the blue box from top to bottom, and hold the change if clocks disagree or context is broken. Source: composed by the author based on OpenTelemetry Signals · OpenTelemetry Context Propagation.
Why does this happen?
When the service that receives a request passes the trace context to the next service, the parent-child relationships between spans can be reconstructed. If propagation breaks, downstream work appears as a separate trace, and total latency may be split incorrectly. The service name and deployment revision identify which code produced each record.
When is it a problem?
If clocks disagree or context propagation is broken, there are insufficient grounds to proceed.
Common beginner misconceptions
Do not copy authentication tokens or raw user input into baggage or logs. Also validate trace context that arrives from outside at the trust boundary.
How to verify it yourself
First compare service.name, the revision, and the environment. Distinguish the trace ID, span ID, and parent span ID for the gateway and the runtime.
To summarize this sectionYou succeed when you write down two pieces of evidence that link the requests, along with the unobserved window, and explain the order for checking the queue span and clocks.

CHAPTER 1 / 5

Start the check at the gateway

Do not guess the cause and start by changing settings. If you group the following evidence into records from the same time window, another operator can reproduce the boundary at which the expected state broke.

1. Compare service.name, revision, and environment first. 2. Distinguish the trace ID, span ID, and parent span ID of the gateway and the runtime. 3. Check the timezone and clock skew of the start and end times. 4. Record spans that were not collected as unconfirmed, not as zero latency.

CHAPTER 2 / 5

Pins down the lab target for context propagation

Commands for reproducing the isolated environment · do not run them in the browser
jq -c '{service,revision,trace_id,span_id,parent_span_id,duration_ms}' gateway.json runtime.json

CHAPTER 3 / 5

Distinguishes runtime output from its meaning

Expected output for training · not an actual measurement
{"service":"gateway","revision":"r7","trace_id":"4bf92f3577b34da6a3ce929d0e0e4736","span_id":"00f067aa0ba902b7","parent_span_id":null,"duration_ms":420}
{"service":"runtime","revision":"r7","trace_id":"4bf92f3577b34da6a3ce929d0e0e4736","span_id":"b7ad6b7169203331","parent_span_id":"00f067aa0ba902b7","duration_ms":90}

CHAPTER 4 / 5

Decide whether to proceed or stop at the missing window

CHAPTER 5 / 5

Re-verify recovery for observability signals and shared context

CONCRETE CASES

Read the two example logs below and write down whether they belong to the same request and what evidence would break down the 330ms further. The commands are a reference for querying the same fields in an isolated environment; in the browser, you only read the output.

In the training example, the gateway responded after 420 ms, while the runtime span is 90 ms. You cannot immediately conclude that the remaining 330 ms is network delay. First check queue waiting, serialization, missing spans, and clock differences.

Wrong responses and boundaries to check

Do not copy authentication tokens or raw user input into baggage or logs. Also validate trace context that arrives from outside at the trust boundary.

Once you find the boundary where the context is broken, verify header propagation for the test request and the instrumentation settings in an isolated environment. After the fix, send the same request again and confirm both the span relationships and the absence of personal data. After recovery, measure again with the same commands and the same success criteria. Do not close an incident just because things appear normal.

INTERACTIVE LAB 1 / 2

Lab 1 · Find the basis for a verdict in the output

Enter values in the browser and check the execution results and the failure and recovery paths. No commands are ever sent to real equipment or the NAS.

Lab scenario:: Read the two example logs below and write down whether they belong to the same request and what evidence would break down the 330 ms further. The commands are a reference for querying the same fields in an isolated environment; in the browser, you only read the output. Instructions:: In the browser, read the training output below and write a verdict. Do not send the commands to real equipment. To reproduce the commands separately, prepare an approved isolated environment with the relevant tools and example files. Save the entire output, and if clocks disagree or the context is broken, do not move on to the next change.

{"service":"gateway","revision":"r7","trace_id":"4bf92f3577b34da6a3ce929d0e0e4736","span_id":"00f067aa0ba902b7","parent_span_id":null,"duration_ms":420}
{"service":"runtime","revision":"r7","trace_id":"4bf92f3577b34da6a3ce929d0e0e4736","span_id":"b7ad6b7169203331","parent_span_id":"00f067aa0ba902b7","duration_ms":90}

The point is not to memorize the values themselves but to confirm that the trace IDs match, the parent relationship holds, and time outside the observed scope is recorded separately. The values shown are reproduced examples for training, not measurements taken on real equipment. Identifiers and values can differ by device, driver, and cluster.

INTERACTIVE LAB 2 / 2

Lab 2 · Plan for stopping and recovery

Enter values in the browser and check the execution results and the failure and recovery paths. No commands are ever sent to real equipment or the NAS.

Do not copy authentication tokens or raw user input into baggage or logs. Also validate trace context that arrives from outside at the trust boundary.

KEY TERMS

Key terms in this unit

Trace context
The identifying information that carries the trace and span relationships between services.

UNIT WORKBOOK

Exercises and worksheets for applying concepts to new situations

Start by checking basic principles, then expand to practical workplace decisions. After submitting an answer, you can see why every option is correct or incorrect, not just the correct answer.

Document the stop conditions and recovery evidence for observability signals and shared context in a work record.

PERSONAL WORKSHEET

A learning worksheet you adapt to your own environment

Your input remains only on the current browser screen and is not stored or transmitted externally. Use categories and pseudonyms instead of actual sensitive information.

OFFICIAL SOURCES

Verify against official sources

Reviewed against official documentation and training output. Commands and performance tests on real hardware are unconfirmed.

CORE UNIT 2 / 4

Metrics and dashboards

Work backwards from the SLIs and SLOs to the metrics and dashboards you need.

Difficulty
Intermediate
Structure
Lessons 5 · Labs 2 · Assessment

Diagrams and tables: composed by the author using each lesson's official primary sources. Find the originals and review dates at the end of that lesson.

PREREQUISITE CHECK

Three things to check before reading

This is not a test of memorized answers. Think about each question first, then open the explanation to review the foundational concepts used in this course.

1Does this unit send commands to real equipment?

No. Read the training output in the browser and make the judgment there. Any separate reproduction is done only in an approved isolated environment.

2What permissions and environment must you confirm before the lab?

Provided records are read-only · no access to production collectors. Example addresses are for documentation only; do not send real requests to them.

3What evidence did you record in the previous unit, "Observability signals and shared context"?

You succeed when you write down two pieces of evidence that link the requests, note the unobserved window, and explain the order for checking the queue span and clocks.

TEXTBOOK GUIDE

Main text that covers each concept from its background to the criteria for judging it

We explain the material section by section so readers new to IT can connect causes and effects without memorizing terms.

  1. Explain the components and failure boundaries of Metrics and dashboards with a diagram.
  2. Judge the state of Metrics and dashboards from command output and observed values.
  3. Write the stop conditions and recovery evidence for Metrics and dashboards into a work record.
Metrics and dashboards Lab environment and safety boundaries
HardwareA browser fixture of signal and incident records
SoftwarePrometheus HTTP API v1·OpenTelemetry W3C trace context
Required permissionsProvided records are read-only · no access to production collectors
NetworkingThe example addresses are for documentation only; do not send real requests

Reviewed against official documentation and training output. Commands and performance tests on real hardware are unconfirmed.

Applies to version: Prometheus HTTP API v1 · W3C Trace Context version 00 header · Manuscript review date: 2026-09-01

CONCEPT FLOW

How the chapters connect

The chapters are not isolated short answers to memorize. Follow them from left to right to see how each chapter's concepts support the next decision.

  1. 1.Start the check at the counter
  2. 2.Pins the lab target for the same window
  3. 3.Distinguish the output of the ratio calculation from its meaning
  4. 4.Make the go/stop decision on the verdict
  5. 5.Re-verify recovery of Metrics and dashboards
Metrics and dashboards: the overall map. If you lose track while reading the detailed explanations and chapters below, return to this sequence.

CONTROLLED EXPLANATION

Follow the evidence to check, one step at a time

Current explanation · 1/5 · Start the check at the counter

Up next: Pins the lab target for the same window

  1. Start the check at the counter

    Do not guess the cause and start by changing settings. If you group the following evidence into records from the same time window, another operator can reproduce the boundary at which the expected state broke.

  2. Pins the lab target for the same window

    Lab scenario:: Below is a training example that queries http_requests_total. Read the result 0.02 and the 5-minute window, and write down how you would change the display when there are 0 requests. Instructions:: In the browser, read the training output below and write a verdict. Do not send the commands to real equipment. To reproduce the commands separately, prepare an approved isolated environment with the relevant tools and example files. Save the entire output, and if the denominator is 0, collection is missing, or label counts explode, do not move on to the next change.

  3. Distinguish the output of the ratio calculation from its meaning

    The point is not to memorize the values themselves but to confirm that the value 0.02 means 2% and that it cannot be generalized beyond the 5-minute window of the query. The values shown are reproduced examples for training, not measurements taken on real equipment. Identifiers and values can differ by device, driver, and cluster.

  4. Make the go/stop decision on the verdict

    Success means presenting panel definitions that state type, unit, interval, and denominator, show No data explicitly, and use a finite label set. Record the execution time, target identity, commands used, key output, verdict, and next action together in the result.

  5. Re-verify recovery of Metrics and dashboards

    If the number of time series explodes, preserve the collection change revision and the series count per label. On a canary with the unbounded label removed, compare the collected volume and query results again, and handle the existing data according to the retention policy. After recovery, measure again with the same commands and the same success criteria. Do not close an incident just because things appear normal.

Conceptual explanation 01

Build the error rate from a numerator and denominator over the same window

Counter (cumulative count): a value that increases except on events such as restarts; its increase over an interval gives the rate at which events occur.

A cumulative counter and a current-value gauge answer different questions. A request counter of 10,000 is the total since measurement began, not requests per second. To know the change over time you must use the observation window together with the increase.

Prometheus rate estimates the per-second increase of a counter and handles resets caused by restarts. Computing the rate per instance before summing reduces the risk of misreading a reset. Histogram buckets aggregate the latency distribution, so they reveal slow requests that an average alone hides.

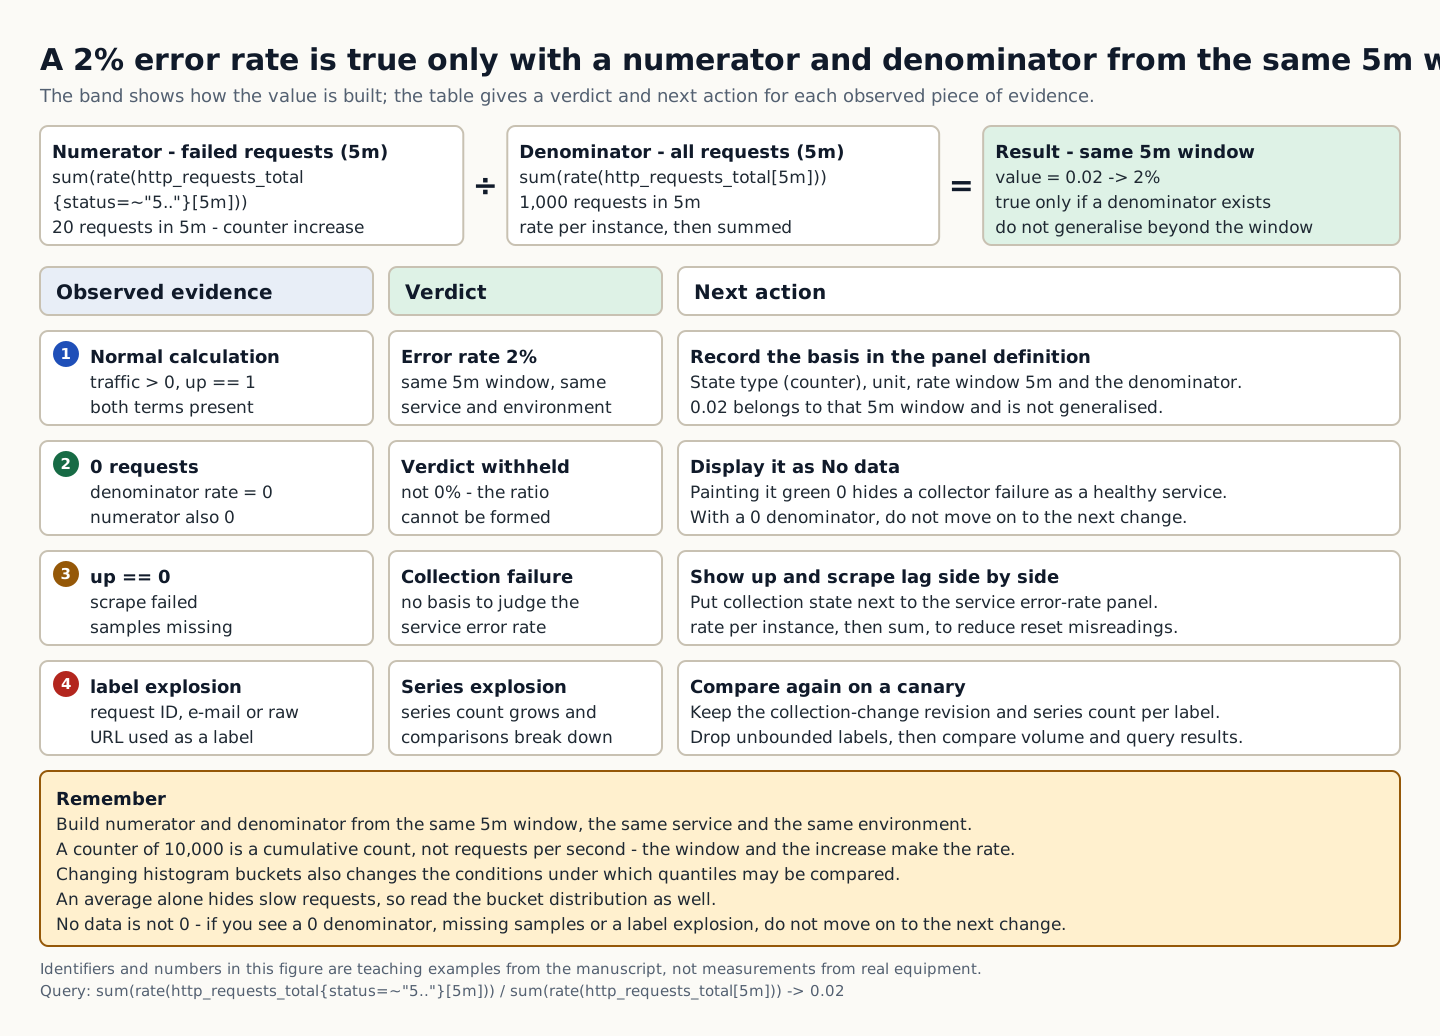
In the example, there are 1,000 requests and 20 failures over 5 minutes. The error rate is 2%, but when traffic is 0, the ratio cannot be determined. If a dashboard paints No data as a green 0, a collector failure is mistaken for a healthy service.

Below is a training example that queries http_requests_total. Read the result 0.02 and the 5-minute window, and write down how you would change the display when there are 0 requests.

A table that derives a 2% error rate from 20 failures out of 1,000 requests in a 5-minute window, and withholds the verdict when the denominator is 0, collection is missing, or labels explode.
How to read the figure An error rate is calculated from a numerator and a denominator taken from the same observation window. Reading the top band from left to right shows how the numerator of 20, the denominator of 1,000, and the result of 0.02 connect. The table below has three columns (observed evidence, verdict, and next action) and is read from row 1 to row 4, top to bottom. Row 1 means the 2% verdict holds only when traffic is greater than 0 and up is 1; rows 2 to 4 are the conditions for withholding a verdict: a denominator of 0, missing collection, and a label explosion. Coloring No data as a green 0 makes a collector failure look healthy, so states are written in text rather than conveyed by color. The last box summarizes the calculation premises (same window, same service, same environment) and the effect of changing histogram buckets. The identifiers and numbers in the figure are training examples composed by the author, not values measured on real equipment. Source: composed by the author based on Prometheus Query functions · Prometheus Metric types.
Why does this happen?
Prometheus rate estimates the per-second increase of a counter and handles resets caused by restarts. Computing the rate per instance before summing reduces the risk of misreading a reset. Histogram buckets aggregate the latency distribution, so they reveal slow requests that an average alone would hide.
When is it a problem?
If you see a zero denominator, missing collection, or label explosion, there are insufficient grounds to proceed.
Common beginner misconceptions
Do not use request IDs, user emails, or raw URLs as metric labels. Changing histogram buckets also changes the conditions for comparing quantiles.
How to verify it yourself
Check the metric type and unit. Record the rate window, the scrape interval, and whether a reset occurred.
To summarize this sectionYou succeed when you present panel definitions that state the type, unit, window, and denominator, along with a No data display and a bounded label list.

CHAPTER 1 / 5

Start the check at the counter

Do not guess the cause and start by changing settings. If you group the following evidence into records from the same time window, another operator can reproduce the boundary at which the expected state broke.

1. Check the metric type and unit. 2. Record the rate window, the scrape interval, and whether a reset occurred. 3. Align the service, environment, and time window of the numerator and the denominator. 4. Show No data, up, and collection delay next to the service error rate.

CHAPTER 2 / 5

Pins the lab target for the same window

Commands for reproducing the isolated environment · do not run them in the browser
curl -fsSG http://127.0.0.1:9090/api/v1/query --data-urlencode 'query=sum(rate(http_requests_total{status=~"5.."}[5m])) / sum(rate(http_requests_total[5m]))'

CHAPTER 3 / 5

Distinguish the output of the ratio calculation from its meaning

Expected output for training · not an actual measurement
{"status":"success","data":{"resultType":"vector","result":[{"metric":{},"value":[1788228000,"0.02"]}]}}

CHAPTER 4 / 5

Make the go/stop decision on the verdict

CHAPTER 5 / 5

Re-verify recovery of Metrics and dashboards

CONCRETE CASES

Below is a training example that queries http_requests_total. Read the result 0.02 and the 5-minute window, and write down how you would change the display when there are 0 requests.

In the example, there are 1,000 requests and 20 failures over 5 minutes. The error rate is 2%, but when traffic is 0, the ratio cannot be determined. If a dashboard paints No data as a green 0, a collector failure is mistaken for a healthy service.

Wrong responses and boundaries to check

Do not use request IDs, user email addresses, or original URLs as metric labels. Changing histogram buckets also changes the conditions under which quantiles can be compared.

If the number of time series explodes, preserve the collection change revision and the series count per label. On a canary with the unbounded label removed, compare the collected volume and query results again, and handle the existing data according to the retention policy. After recovery, measure again with the same commands and the same success criteria. Do not close an incident just because things appear normal.

INTERACTIVE LAB 1 / 2

Lab 1 · Find the basis for a verdict in the output

Enter values in the browser and check the execution results and the failure and recovery paths. No commands are ever sent to real equipment or the NAS.

Lab scenario:: Below is a training example that queries http_requests_total. Read the result 0.02 and the 5-minute window, and write down how you would change the display when there are 0 requests. Instructions:: In the browser, read the training output below and write a verdict. Do not send the commands to real equipment. To reproduce the commands separately, prepare an approved isolated environment with the relevant tools and example files. Save the entire output, and if the denominator is 0, collection is missing, or label counts explode, do not move on to the next change.

{"status":"success","data":{"resultType":"vector","result":[{"metric":{},"value":[1788228000,"0.02"]}]}}

The point is not to memorize the values themselves but to confirm that the value 0.02 means 2% and that it cannot be generalized beyond the 5-minute window of the query. The values shown are reproduced examples for training, not measurements taken on real equipment. Identifiers and values can differ by device, driver, and cluster.

INTERACTIVE LAB 2 / 2

Lab 2 · Plan for stopping and recovery

Enter values in the browser and check the execution results and the failure and recovery paths. No commands are ever sent to real equipment or the NAS.

Do not use request IDs, user email addresses, or original URLs as metric labels. Changing histogram buckets also changes the conditions under which quantiles can be compared.

KEY TERMS

Key terms in this unit

Counter (cumulative count)
A value that only increases, except on events such as restarts; its increase over a window is used to calculate the rate of events.

UNIT WORKBOOK

Exercises and worksheets for applying concepts to new situations

Start by checking basic principles, then expand to practical workplace decisions. After submitting an answer, you can see why every option is correct or incorrect, not just the correct answer.

Write the stop conditions and recovery evidence for Metrics and dashboards into a work record.

PERSONAL WORKSHEET

A learning worksheet you adapt to your own environment

Your input remains only on the current browser screen and is not stored or transmitted externally. Use categories and pseudonyms instead of actual sensitive information.

OFFICIAL SOURCES

Verify against official sources

Reviewed against official documentation and training output. Commands and performance tests on real hardware are unconfirmed.

CORE UNIT 3 / 4

Alerts and runbooks

Link symptom alerts to actionable conditions, an owner, and a runbook.

Difficulty
Intermediate
Structure
Lessons 5 · Labs 2 · Assessment

Diagrams and tables: composed by the author using each lesson's official primary sources. Find the originals and review dates at the end of that lesson.

PREREQUISITE CHECK

Three things to check before reading

This is not a test of memorized answers. Think about each question first, then open the explanation to review the foundational concepts used in this course.

1Does this unit send commands to real equipment?

No. Read the training output in the browser and make the judgment there. Any separate reproduction is done only in an approved isolated environment.

2What permissions and environment must you confirm before the lab?

Provided records are read-only · no access to production collectors. Example addresses are for documentation only; do not send real requests to them.

3What evidence did you record in the previous unit, "Metrics and dashboards"?

Success means presenting panel definitions that state type, unit, interval, and denominator, show No data explicitly, and use a finite label set.

TEXTBOOK GUIDE

Main text that covers each concept from its background to the criteria for judging it

We explain the material section by section so readers new to IT can connect causes and effects without memorizing terms.

  1. Explain the components and failure boundaries of alerts and runbooks using a diagram.
  2. Judge the state of alerts and runbooks from command output and observed values.
  3. Document the stop conditions and recovery evidence for alerts and runbooks in a work record.
Alerts and runbooks Lab environment and safety boundaries
HardwareA browser fixture of signal and incident records
SoftwarePrometheus HTTP API v1·OpenTelemetry W3C trace context
Required permissionsProvided records are read-only · no access to production collectors
NetworkingThe example addresses are for documentation only; do not send real requests

Reviewed against official documentation and training output. Commands and performance tests on real hardware are unconfirmed.

Applies to version: Prometheus HTTP API v1 · W3C Trace Context version 00 header · Manuscript review date: 2026-09-01

CONCEPT FLOW

How the chapters connect

The chapters are not isolated short answers to memorize. Follow them from left to right to see how each chapter's concepts support the next decision.

  1. 1.Start the checks from the user impact
  2. 2.Fix the lab target for sustained confirmation
  3. 3.Distinguish the output of alert delivery from its meaning
  4. 4.Decides whether the runbook proceeds or stops
  5. 5.Re-verify recovery of alerts and runbooks
Alerts and runbooks: the overall map. If you lose track while reading the detailed explanations and chapters below, return to this sequence.

CONTROLLED EXPLANATION

Follow the evidence to check, one step at a time

Current explanation · 1/5 · Start the checks from the user impact

Up next: Fix the lab target for sustained confirmation

  1. Start the checks from the user impact

    Do not guess the cause and start by changing settings. If you group the following evidence into records from the same time window, another operator can reproduce the boundary at which the expected state broke.

  2. Fix the lab target for sustained confirmation

    Lab scenario:: Judge whether a successful syntax check of the example rule guarantees delivery of the alert, and design two separate tests. Instructions:: In the browser, read the training output below and write a verdict. Do not send the commands to real equipment. To reproduce the commands separately, prepare an approved isolated environment with the relevant tools and example files. Save the entire output, and if there is no owner, no recovery criterion, or no collected signal, do not move on to the next change.

  3. Distinguish the output of alert delivery from its meaning

    The point is not to memorize the values themselves but to confirm that the first result is about syntax, the second is the success of the prepared time-series test, and that evidence of actual receipt by the recipient is separate. The values shown are reproduced examples for training, not measurements taken on real equipment. Identifiers and values can differ by device, driver, and cluster.

  4. Decides whether the runbook proceeds or stops

    You succeed when you write down the expected state for healthy, sustained-failure, recovery, and collection-stopped inputs, along with the procedure for owner receipt and recovery confirmation. Record the execution time, target identity, commands used, key output, verdict, and next action together in the result.

  5. Re-verify recovery of alerts and runbooks

    If a false positive occurs, preserve the time series and the rule revision for that window. Test the corrected rule against both the past window and an artificial failure window, then apply it as a canary. After recovery, measure again with the same commands and the same success criteria. Do not close an incident just because things appear normal.

Conceptual explanation 01

Sustained user impact leads to action by an owner

Runbook: the procedure of actions an operator takes, running from the symptom to checking, stopping, mitigating, and re-verifying.

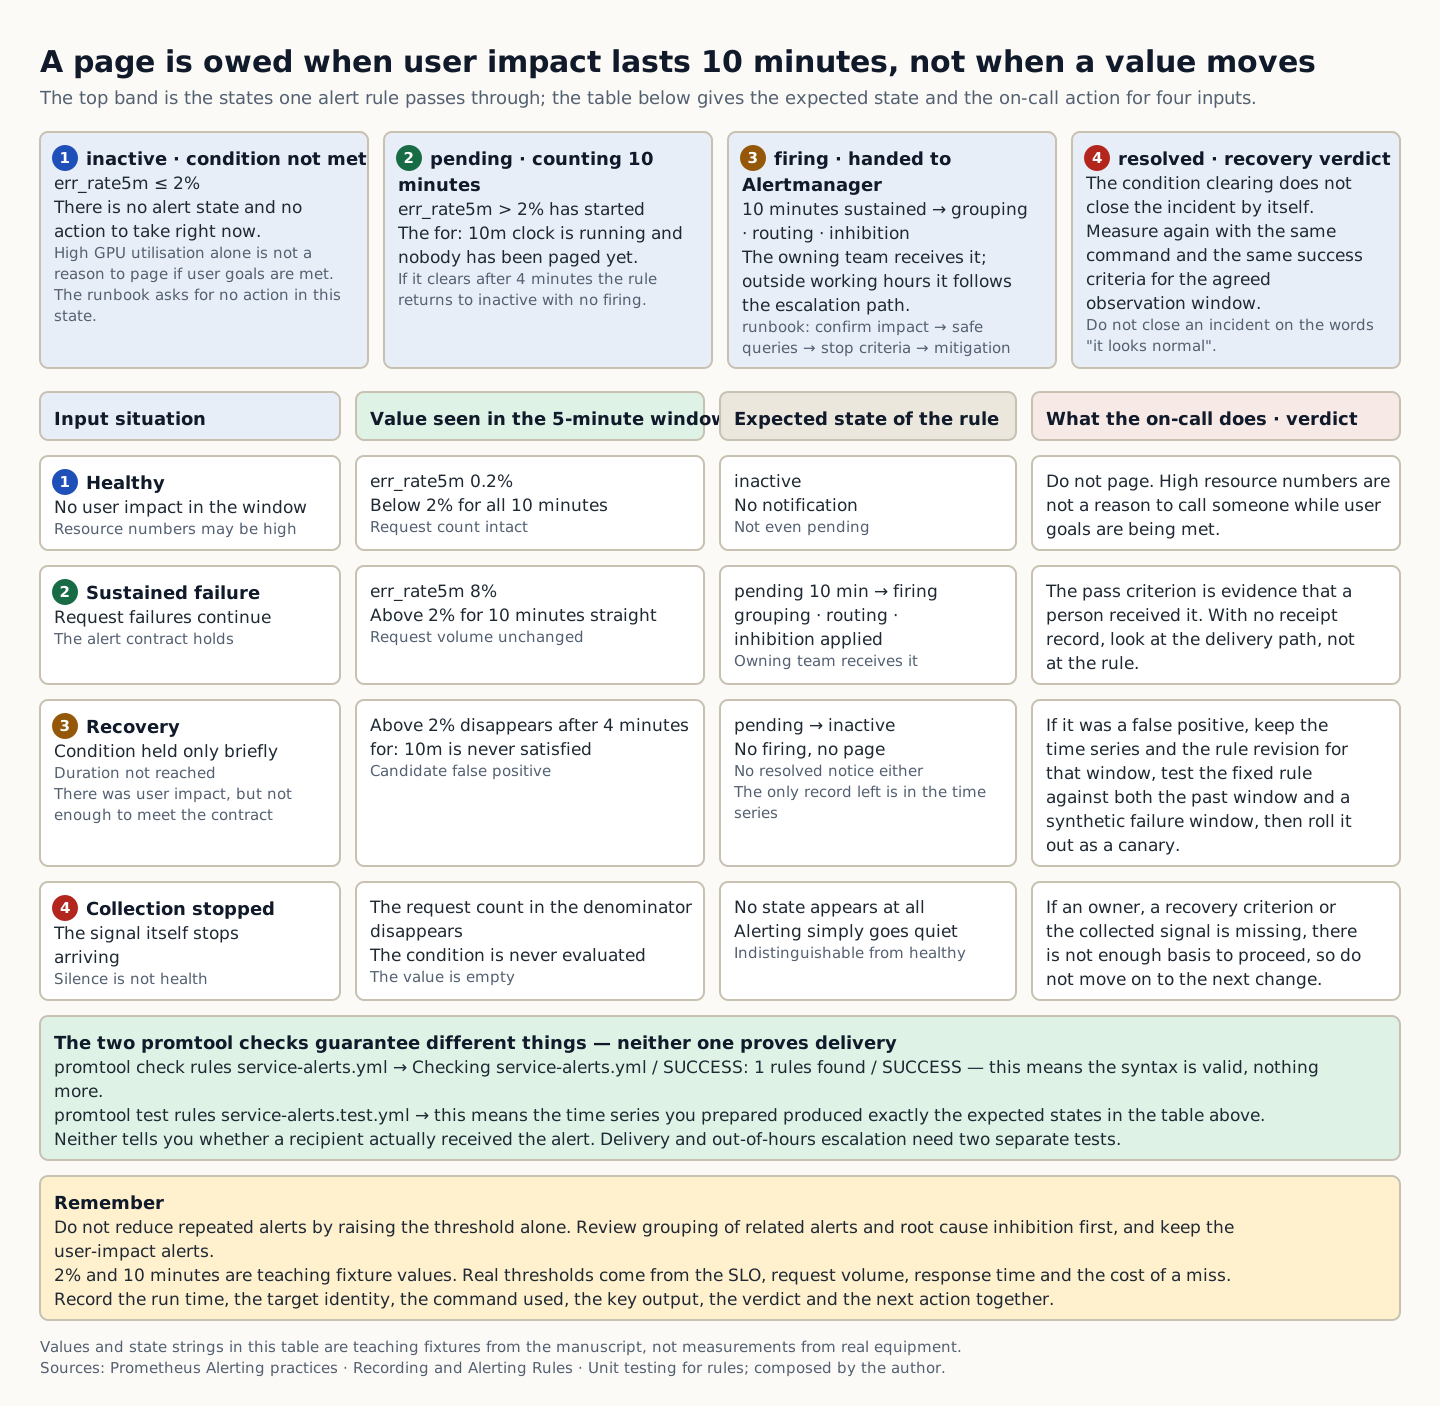
An alert is not a notice that a value has changed; it is a contract that someone has an action to take right now. Even when GPU utilization is high, there may be no reason to page anyone if user targets are still being met. Conversely, if request failures persist, you must respond even when resource metrics are low.

An alerting rule evaluates a condition and its duration, while Alertmanager handles grouping, routing, inhibition, and similar tasks. A runbook ties together impact assessment, safe inspection, stop criteria, mitigation, and the recovery verdict in sequence. An alert without an owner and a verified action remains noise.

In the fixture, a page fires when the 5-minute error rate stays above 2% for 10 minutes. This is a teaching threshold, not the right threshold for every service. Real thresholds are set from the SLO, request volume, response time, and the cost of a miss.

Judge whether a successful syntax check of the example rule also guarantees alert delivery, and design two separate tests.

A state band showing an alert rule passing through inactive, pending, firing, and resolved, with a table giving the expected state and the on-call action for four inputs: healthy, sustained failure, recovery, and stopped collection
How to read the figure Reading the top band from left to right shows the states a single alert rule passes through. When err_rate5m is at or below 2%, the rule is inactive; once it exceeds 2%, it enters pending and counts for: 10m; after 10 minutes, it becomes firing and is passed to Alertmanager; and when the condition clears, recovery is judged in resolved. The table below shows the expected state when four different inputs are applied to the same rule; read each row from left to right as the input situation, the value observed in the 5-minute window, the expected state of the alert rule, and the responder's actions and verdict order. The pass criterion is the fourth column, not the state name. The sustained failure row passes only with evidence that the responder received the alert, and in the collection stopped row, silence is not read as healthy. The green box distinguishes how far each of the two promtool checks actually guarantees, and the amber box summarizes the rule of not simply raising the threshold and the conditions for stopping when there is no owner, recovery criterion, or collected signal. Each box can be read from its title alone without distinguishing colors. The values and state strings in the table, including 2% and 10 minutes, are a training fixture, not results measured on real equipment. The figure does not depict time proportions or the internal structure of Alertmanager; it shows only states and verdicts. Source: composed by the author based on Prometheus Alerting practices · Prometheus Recording and Alerting Rules · Prometheus Unit testing for rules.
Why does this happen?
An alerting rule evaluates a condition and a duration, while Alertmanager handles grouping, routing, inhibition, and so on. The runbook connects impact confirmation, safe queries, stop criteria, and the order of mitigation and recovery decisions. An alert with no owner and no verified action remains noise.
When is it a problem?
If an owner, recovery criteria, or collected signals are missing, there are insufficient grounds to proceed.
Common beginner misconceptions
Do not simply raise thresholds to reduce repeated alerts. Review grouping of related alerts and root-cause inhibition, and keep the user-impact alerts.
How to verify it yourself
Link the user impact to the rule's denominator. Distinguish the pending, firing, and resolved states and their durations.
To summarize this sectionYou succeed when you write down the expected state for healthy, sustained-failure, recovery, and collection-stopped inputs, along with the procedure for owner receipt and recovery confirmation.

CHAPTER 1 / 5

Start the checks from the user impact

Do not guess the cause and start by changing settings. If you group the following evidence into records from the same time window, another operator can reproduce the boundary at which the expected state broke.

1. Connect the user impact to the denominator of the rule. 2. Distinguish the pending, firing, and resolved states and their durations. 3. Check the routing target and the after-hours escalation path. 4. Decide which runbook actions to verify and how long to observe for a return to normal.

CHAPTER 2 / 5

Fix the lab target for sustained confirmation

Commands for reproducing the isolated environment · do not run them in the browser
promtool check rules service-alerts.yml
promtool test rules service-alerts.test.yml

CHAPTER 3 / 5

Distinguish the output of alert delivery from its meaning

Expected output for training · not an actual measurement
Checking service-alerts.yml
  SUCCESS: 1 rules found

SUCCESS

CHAPTER 4 / 5

Decides whether the runbook proceeds or stops

CHAPTER 5 / 5

Re-verify recovery of alerts and runbooks

CONCRETE CASES

Judge whether a successful syntax check of the example rule also guarantees alert delivery, and design two separate tests.

In the fixture, a page fires when the 5-minute error rate stays above 2% for 10 minutes. This is a teaching threshold, not the right threshold for every service. Real thresholds are set from the SLO, request volume, response time, and the cost of a miss.

Wrong responses and boundaries to check

Do not simply raise thresholds to reduce repeated alerts. Review grouping of related alerts and root cause inhibition, and keep the alerts for user impact.

If a false positive occurs, preserve the time series and the rule revision for that window. Test the corrected rule against both the past window and an artificial failure window, then apply it as a canary. After recovery, measure again with the same commands and the same success criteria. Do not close an incident just because things appear normal.

INTERACTIVE LAB 1 / 2

Lab 1 · Find the basis for a verdict in the output

Enter values in the browser and check the execution results and the failure and recovery paths. No commands are ever sent to real equipment or the NAS.

Lab scenario:: Judge whether a successful syntax check of the example rule guarantees delivery of the alert, and design two separate tests. Instructions:: In the browser, read the training output below and write a verdict. Do not send the commands to real equipment. To reproduce the commands separately, prepare an approved isolated environment with the relevant tools and example files. Save the entire output, and if there is no owner, no recovery criterion, or no collected signal, do not move on to the next change.

Checking service-alerts.yml
  SUCCESS: 1 rules found

SUCCESS

The point is not to memorize the values themselves but to confirm that the first result is about syntax, the second is the success of the prepared time-series test, and that evidence of actual receipt by the recipient is separate. The values shown are reproduced examples for training, not measurements taken on real equipment. Identifiers and values can differ by device, driver, and cluster.

INTERACTIVE LAB 2 / 2

Lab 2 · Plan for stopping and recovery

Enter values in the browser and check the execution results and the failure and recovery paths. No commands are ever sent to real equipment or the NAS.

Do not simply raise thresholds to reduce repeated alerts. Review grouping of related alerts and root cause inhibition, and keep the alerts for user impact.

KEY TERMS

Key terms in this unit

Runbook
An owner's action procedure that moves from symptom to confirmation, stopping, mitigation, and re-verification.

UNIT WORKBOOK

Exercises and worksheets for applying concepts to new situations

Start by checking basic principles, then expand to practical workplace decisions. After submitting an answer, you can see why every option is correct or incorrect, not just the correct answer.

Document the stop conditions and recovery evidence for alerts and runbooks in a work record.

PERSONAL WORKSHEET

A learning worksheet you adapt to your own environment

Your input remains only on the current browser screen and is not stored or transmitted externally. Use categories and pseudonyms instead of actual sensitive information.

OFFICIAL SOURCES

Verify against official sources

Reviewed against official documentation and training output. Commands and performance tests on real hardware are unconfirmed.

CORE UNIT 4 / 4

Incident response and postmortem

Record the timeline, roles, recovery, re-verification under the same conditions, and prevention of recurrence.

Difficulty
Intermediate
Structure
Lessons 5 · Labs 2 · Assessment

Diagrams and tables: composed by the author using each lesson's official primary sources. Find the originals and review dates at the end of that lesson.

PREREQUISITE CHECK

Three things to check before reading

This is not a test of memorized answers. Think about each question first, then open the explanation to review the foundational concepts used in this course.

1Does this unit send commands to real equipment?

No. Read the training output in the browser and make the judgment there. Any separate reproduction is done only in an approved isolated environment.

2What permissions and environment must you confirm before the lab?

Provided records are read-only · no access to production collectors. Example addresses are for documentation only; do not send real requests to them.

3What evidence did you record in the previous unit, "Alerts and runbooks"?

You succeed when you write down the expected state for healthy, sustained-failure, recovery, and collection-stopped inputs, along with the procedure for owner receipt and recovery confirmation.

TEXTBOOK GUIDE

Main text that covers each concept from its background to the criteria for judging it

We explain the material section by section so readers new to IT can connect causes and effects without memorizing terms.

  1. Explain the components and failure boundaries of Incident response and postmortem with a diagram.
  2. Judge the state of Incident response and postmortem from command output and observed values.
  3. Write the stop conditions and recovery evidence for Incident response and postmortem into a work record.
Incident response and postmortem Lab environment and safety boundaries
HardwareA browser fixture of signal and incident records
SoftwarePrometheus HTTP API v1·OpenTelemetry W3C trace context
Required permissionsProvided records are read-only · no access to production collectors
NetworkingThe example addresses are for documentation only; do not send real requests

Reviewed against official documentation and training output. Commands and performance tests on real hardware are unconfirmed.

Applies to version: Prometheus HTTP API v1 · W3C Trace Context version 00 header · Manuscript review date: 2026-09-01

CONCEPT FLOW

How the chapters connect

The chapters are not isolated short answers to memorize. Follow them from left to right to see how each chapter's concepts support the next decision.

  1. 1.Start the checks at impact detection
  2. 2.Fix the lab target for declaring a response
  3. 3.Distinguish the output of the mitigation run from what it means
  4. 4.Make the go/stop decision on re-verification
  5. 5.Re-verify recovery of Incident response and postmortem
Incident response and postmortem: the overall map. If you lose track while reading the detailed explanations and chapters below, return to this sequence.

CONTROLLED EXPLANATION

Follow the evidence to check, one step at a time

Current explanation · 1/5 · Start the checks at impact detection

Up next: Fix the lab target for declaring a response

  1. Start the checks at impact detection

    Do not guess the cause and start by changing settings. If you group the following evidence into records from the same time window, another operator can reproduce the boundary at which the expected state broke.

  2. Fix the lab target for declaring a response

    Lab scenario:: Read the timeline fixture and write a shift handover document that separates the recovery time, the tentative hypothesis, and the items still unknown. Instructions:: In the browser, read the training output below and write a verdict. Do not send the commands to real equipment. To reproduce the commands separately, prepare an approved isolated environment with the relevant tools and example files. Save the entire output, and if a case is being closed without evidence or changes are being made at the same time, do not move on to the next change.

  3. Distinguish the output of the mitigation run from what it means

    The point is not to memorize the values themselves but to confirm that observation, decision, and action are separated and that recovery was verified at the same request volume. The values shown are reproduced examples for training, not measurements taken on real equipment. Identifiers and values can differ by device, driver, and cluster.

  4. Make the go/stop decision on re-verification

    You succeed when you include the affected window, the mitigation rationale, a falsifiable cause hypothesis, unconfirmed items, and the owner of the recurrence check. Record the execution time, target identity, commands used, key output, verdict, and next action together in the result.

  5. Re-verify recovery of Incident response and postmortem

    If the service degrades again after recovery, reopen the incident and compare against the last healthy revision and dependency state. Do not complete the ownership transfer until the receiving owner has reproduced the current state with the same queries. After recovery, measure again with the same commands and the same success criteria. Do not close an incident just because things appear normal.

Conceptual explanation 01

Record facts and decisions on a timeline to verify the recovery

Postmortem: a document that organizes the impact, the timeline, the causal conditions, and the preventive actions as evidence.

In incident response, separate service mitigation from root-cause analysis. Waiting until the cause is confirmed can increase the damage, but applying several changes at once without evidence makes it impossible to tell which action worked. Divide the command, execution, and communication roles to reduce conflicts.

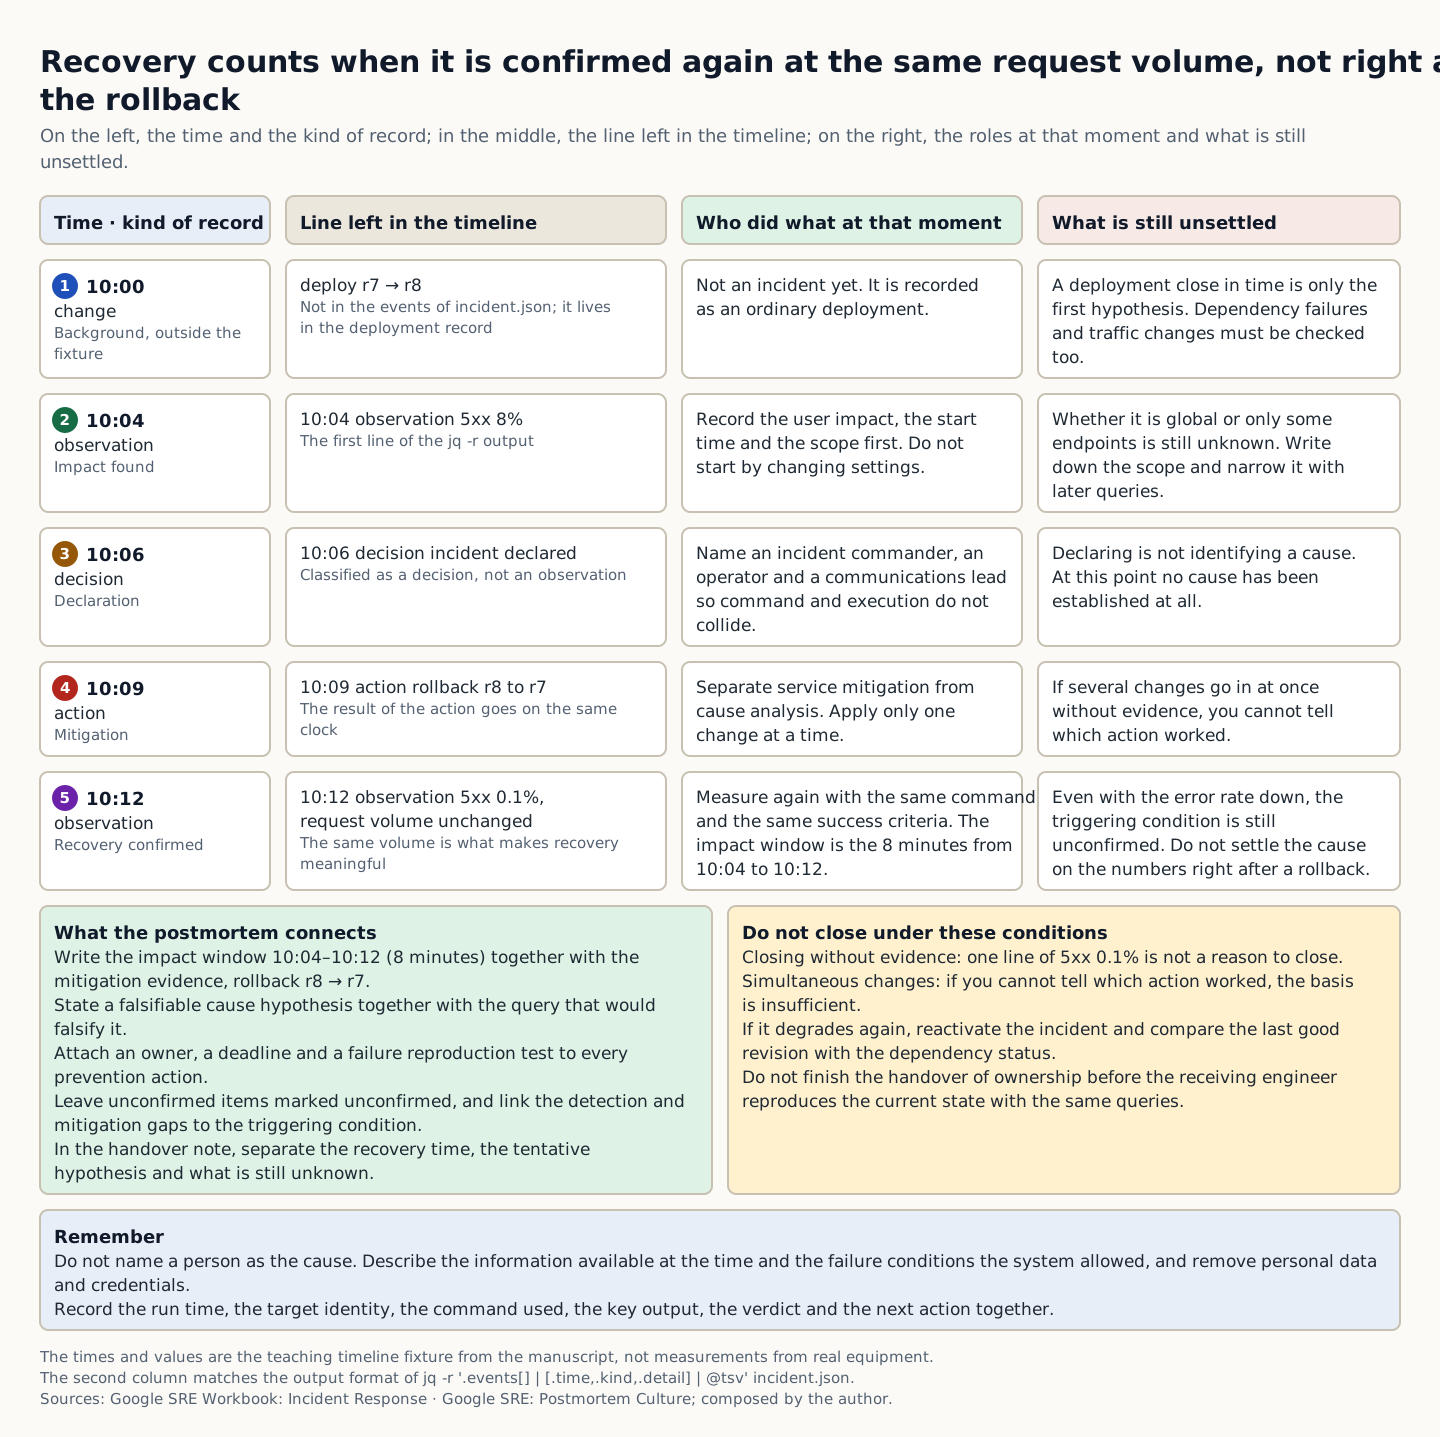
A timeline records observed facts, hypotheses, decisions, and the results of actions on the same time base. Even if the error rate drops right after a rollback, do not conclude that the cause is fully understood. In the later postmortem, connect the triggering conditions to the gaps in detection and mitigation.

The training incident runs in this order: deployment at 10:00, error rate rise at 10:04, incident declared at 10:06, rollback at 10:09, recovery confirmed at 10:12. A deployment close in time is the first hypothesis, but you must also check dependency failures and traffic changes.

Read the timeline fixture and write a shift handover document that separates the recovery time, the tentative hypotheses, and the items still unknown.

A table that splits a five-line timeline, from the 10:00 deployment to the 10:12 recovery check, into observation, decision, and action, along with the roles at each point and what is not yet confirmed
How to read the figure Read the table from top to bottom in chronological order. The first column gives the time and record type (change · observation · decision · action), and the second is the line recorded in the timeline, in the same format as the output of jq -r '.events[] | [.time,.kind,.detail] | @tsv'. The third column is who did what at that time, and the fourth is what was not yet confirmed at that point. Use the fourth column to confirm that the declaration at 10:06 does not confirm a cause, that the rollback at 10:09 is only mitigation, and that recovery is accepted only when request volume unchanged is also observed at 10:12. The lower-left box summarizes how the postmortem links the impact window, the mitigation evidence, falsifiable hypotheses, and the owners and deadlines of prevention actions, and the right box lists conditions under which an incident is not closed, such as closing without evidence or making simultaneous changes. Each box can be read from its title alone without distinguishing colors. The times and values are a training timeline fixture, not results measured on real equipment. The figure does not depict every response procedure or time proportions; it shows only record types and verdicts. Source: composed by the author based on Google SRE Workbook: Incident Response · Google SRE: Postmortem Culture.
Why does this happen?
A timeline records observed facts, hypotheses, decisions, and execution results on a single time base. Even if the error rate drops right after a rollback, do not conclude that the cause has been fully identified. The later postmortem connects the triggering conditions to gaps in detection and mitigation.
When is it a problem?
If a case is closed without evidence or changes are made at the same time, there are insufficient grounds to proceed.
Common beginner misconceptions
Do not name a specific person as the cause. Describe the information available at the time and the failure conditions the system allowed, and remove personal information and credentials.
How to verify it yourself
Record the user impact, the start time, and the scope first. Assign the incident commander, the operator, and the communications owner.
To summarize this sectionYou succeed when you include the affected window, the mitigation rationale, a falsifiable cause hypothesis, unconfirmed items, and the owner of the recurrence check.

CHAPTER 1 / 5

Start the checks at impact detection

Do not guess the cause and start by changing settings. If you group the following evidence into records from the same time window, another operator can reproduce the boundary at which the expected state broke.

1. Record the user impact, start time, and scope first. 2. Designate the incident commander, the operator, and the communications lead. 3. Record the hypothesis, expected effect, and actual effect of each change. 4. Attach an owner, a deadline, and a failure reproduction check to each preventive action.

CHAPTER 2 / 5

Fix the lab target for declaring a response

Commands for reproducing the isolated environment · do not run them in the browser
jq -r '.events[] | [.time,.kind,.detail] | @tsv' incident.json

CHAPTER 3 / 5

Distinguish the output of the mitigation run from what it means

Expected output for training · not an actual measurement
10:04	observation	5xx 8%
10:06	decision	incident declared
10:09	action	rollback r8 to r7
10:12	observation	5xx 0.1%, request volume unchanged

CHAPTER 4 / 5

Make the go/stop decision on re-verification

CHAPTER 5 / 5

Re-verify recovery of Incident response and postmortem

CONCRETE CASES

Read the timeline fixture and write a shift handover document that separates the recovery time, the tentative hypotheses, and the items still unknown.

The training incident runs in this order: deployment at 10:00, error rate rise at 10:04, incident declared at 10:06, rollback at 10:09, recovery confirmed at 10:12. A deployment close in time is the first hypothesis, but you must also check dependency failures and traffic changes.

Wrong responses and boundaries to check

Do not name a specific person as the cause. Describe the information available at the time and the failure conditions the system allowed, and remove personal information and credentials.

If the service degrades again after recovery, reopen the incident and compare against the last healthy revision and dependency state. Do not complete the ownership transfer until the receiving owner has reproduced the current state with the same queries. After recovery, measure again with the same commands and the same success criteria. Do not close an incident just because things appear normal.

INTERACTIVE LAB 1 / 2

Lab 1 · Find the basis for a verdict in the output

Enter values in the browser and check the execution results and the failure and recovery paths. No commands are ever sent to real equipment or the NAS.

Lab scenario:: Read the timeline fixture and write a shift handover document that separates the recovery time, the tentative hypothesis, and the items still unknown. Instructions:: In the browser, read the training output below and write a verdict. Do not send the commands to real equipment. To reproduce the commands separately, prepare an approved isolated environment with the relevant tools and example files. Save the entire output, and if a case is being closed without evidence or changes are being made at the same time, do not move on to the next change.

10:04	observation	5xx 8%
10:06	decision	incident declared
10:09	action	rollback r8 to r7
10:12	observation	5xx 0.1%, request volume unchanged

The point is not to memorize the values themselves but to confirm that observation, decision, and action are separated and that recovery was verified at the same request volume. The values shown are reproduced examples for training, not measurements taken on real equipment. Identifiers and values can differ by device, driver, and cluster.

INTERACTIVE LAB 2 / 2

Lab 2 · Plan for stopping and recovery

Enter values in the browser and check the execution results and the failure and recovery paths. No commands are ever sent to real equipment or the NAS.

Do not name a specific person as the cause. Describe the information available at the time and the failure conditions the system allowed, and remove personal information and credentials.

KEY TERMS

Key terms in this unit

Postmortem
A document that records impact, timeline, causal conditions, and recurrence-prevention actions as evidence.

UNIT WORKBOOK

Exercises and worksheets for applying concepts to new situations

Start by checking basic principles, then expand to practical workplace decisions. After submitting an answer, you can see why every option is correct or incorrect, not just the correct answer.

Write the stop conditions and recovery evidence for Incident response and postmortem into a work record.

PERSONAL WORKSHEET

A learning worksheet you adapt to your own environment

Your input remains only on the current browser screen and is not stored or transmitted externally. Use categories and pseudonyms instead of actual sensitive information.

OFFICIAL SOURCES

Verify against official sources

Reviewed against official documentation and training output. Commands and performance tests on real hardware are unconfirmed.

DECISION ACTIVITY

GPU utilization is normal, but p99 user response time has doubled. What do you do first?

First write down the evidence you need and the stop criteria, then choose a verdict.

Choose an answer

THREE-LEVEL ASSESSMENT

From basic principles to operational decisions

When you submit an answer you can see why every option is right or wrong.

Basic Question 1

What problem does putting a trace ID into a metric label cause?

Choose an answer
Apply Question 2

Out of 1,000 requests, 20 failed. What is the error rate for that window?

Choose an answer
Capstone Question 3

Which is the most appropriate postmortem action after recovery?

Choose an answer

LEARNING RECORD

Have you reviewed the text, decision activities, and all explanations?

Completion status is stored only in this browser.