Compare workload, memory, software ecosystem, and operating conditions before product names.
Difficulty
Foundations
Structure
3 core units · 15 chapters
CORE UNIT 1 / 3
CPU·GPU·NPU·TPU
Divide CPU, GPU, NPU, and TPU execution into memory, computation, compiler, and runtime paths, then verify your workload and equipment candidates under the same measurement contract.
Difficulty
Foundations
Structure
Lessons 5 · Labs 2 · Assessment
Diagrams and tables: composed by the author using each lesson's official primary sources. Find the originals and review dates at the end of that lesson.
NEW HIRE ONBOARDING
Start in the order you would receive your first assignment
So that even a new hire with no prior IT background can follow along, we start with the situation, the task, the evidence, and when to report, before difficult definitions.
01
Read the situation in one sentence
Even if the laptop's Task Manager shows an NPU, the model may run only on the CPU or GPU if the selected LLM runtime does not support the NPU backend and model operators.
02
Today's assignment
Divide CPU, GPU, NPU, and TPU execution into memory, computation, compiler, and runtime paths, then verify your workload and equipment candidates under the same measurement contract.
03
Evidence that shows the work is complete
Record effective values and user-facing metrics, not peak specifications.
04
When to stop and ask a senior colleague
Even if a device is present, it goes unused if the software cannot place the model graph on it.
Unpack unfamiliar terms first
Memory bandwidth
A metric for the amount of data a device can read from and write to memory per second, distinguishing theoretical values from effective values under real workloads
Operator
Unit of computation, such as matrix multiplication, attention, or normalization, that makes up a model graph and must be supported by the runtime and device
TOPS
Tera Operations Per Second: a peak metric expressing trillions of operations per second at a specified precision and under specified conditions, distinct from actual tokens/s.
PREREQUISITE CHECK
Three things to check before reading
This is not a test of memorized answers. Think about each question first, then open the explanation to review the foundational concepts used in this course.
1Do memory capacity and memory bandwidth mean the same thing?
They are not the same. Capacity is the number of bytes that can be held at once, and bandwidth is the number of bytes that can be read or written per second. Judge separately whether the model fits and how fast the loaded model can be read repeatedly.
2Can product-table TOPS be converted directly into LLM tokens/s?
No direct conversion is possible. TOPS is a peak under specific precision and operation conditions, while actual tokens per second depends on the model graph, operator/kernel support, memory transfers, context, batch and runtime. Measure by running the same workload.
3If the computer recognizes the accelerator, do all model operations run on that device?
No. The exact OS, driver, and runtime must support the device, and the kernel or compiler must handle the model's operators, shapes, and precision. Check the actual execution device and any CPU fallback in the profiler.
TEXTBOOK GUIDE
Main text that covers each concept from its background to the criteria for judging it
We explain the material section by section so readers new to IT can connect causes and effects without memorizing terms.
CONCEPT FLOW
How the chapters connect
The chapters are not isolated short answers to memorize. Follow them from left to right to see how each chapter's concepts support the next decision.
1.An accelerator is one stage in the execution path prepared by the CPU→
2.Calculate memory capacity, bandwidth, and bytes moved before compute→
3.Precision, operators, compilers, and runtimes determine the actual support path→
4.Distinguish CPU, GPU, NPU, and TPU by role and software ecosystem→
5.Approve equipment with the same workload benchmark and rollback
CPU·GPU·NPU·TPU: the overall map. If you lose track while reading the detailed explanations and chapters below, return to this sequence.
CONTROLLED EXPLANATION
Explore the order in which concepts build on each other
It does not start automatically. Play, or select the previous or next step, to see how the current concept connects to the next decision, step by step.
Current explanation · 1/5
An accelerator is one stage in the execution path prepared by the CPU
To explain execution failures and slow fallback, first map the full path that runs through host·memory·driver·runtime·compiler·operator rather than focusing on the accelerator name.
The CPU handles control, preprocessing, and I/O; the accelerator executes supported tensor operations.
Up next: Calculate memory capacity, bandwidth, and bytes moved before compute, where this standard continues to apply.
See the full step description
1. An accelerator is one stage in the execution path prepared by the CPU
To explain execution failures and slow fallback, first map the full path that runs through host·memory·driver·runtime·compiler·operator rather than focusing on the accelerator name. The CPU handles control, preprocessing, and I/O; the accelerator executes supported tensor operations.
2. Calculate memory capacity, bandwidth, and bytes moved before compute
LLM inference repeatedly reads large weights and caches, so whether they fit on the device and how many bytes per second are actually moved can become bottlenecks before peak compute does. Capacity is how much can be held, and bandwidth is how much can be moved per second.
3. Precision, operators, compilers, and runtimes determine the actual support path
Numbers such as FP16, BF16, INT8, and INT4 on a device translate into real acceleration only when the model operators and runtime kernels and compilers support that combination. Distinguish storage precision from inference precision.
4. Distinguish CPU, GPU, NPU, and TPU by role and software ecosystem
The four devices are not a ranking but different operational paths: general-purpose control, large-scale parallel computation, low-power on-device inference, and cloud-scale matrix systems. CPU-only and hybrid offload are also valid designs.
5. Approve equipment with the same workload benchmark and rollback
Hardware selection is complete only after repeated measurements with model, input, concurrency, and quality held fixed, plus a recovery test that returns to the previous backend after a failure. Record effective values and user-facing metrics, not peak specifications.
The text description below shows the same content without the animation. Your operating system's reduced-motion setting is also respected.Conceptual explanation 01
Reading accelerator performance as a system path from host to response
When a user sends a sentence, the CPU receives the network request, creates token IDs with the tokenizer, and handles queuing and permissions. Model shards in storage are memory-mapped or read into host memory, and the runtime then moves tensors to device memory. Even when a GPU, NPU, or TPU runs the matrix kernels, sampling, some normalization, tool calls, and response serialization can remain on the CPU. Accelerator compute time alone therefore cannot explain End-to-End latency (the delay from request to final response).
The driver provides low-level communication between the operating system and the device, and the runtime turns the model architecture into kernels and a memory plan. For devices that need a compiler, the compiler converts graphs and shapes into device instructions. If model code uses a new operator but the installed runtime has no kernel for it, loading may fail or CPU fallback may occur. A device appearing on screen and a successful package import are not evidence that the actual model graph is accelerated.
Follow arrows between storage, CPU host, runtime/compiler, device memory and compute units in the execution diagram, recording bytes and time at each boundary. Loading, prefill, single-token decoding, cache allocation and output transfer place different demands on these paths. If only the first request is slow, inspect compilation, loading and warm-up; if long generation stays slow, inspect bandwidth, kernels and cache; if only concurrent users trigger slowness, inspect queues and capacity first.
Link profiler execution-device, kernel-timeline, memory-copy, and utilization data to request IDs and model revisions. GPU utilization of 20% alone cannot distinguish slow CPU preparation, a small batch, or memory waits. Conversely, 100% utilization can hide queue latency or thermal throttling. Compare user TTFT·total latency, processed tokens, and errors against the device timeline on the same time axis.
Why does this happen?
This is because the accelerator executes only supported operations from the graph and data prepared by the host, while requests cross multiple software·memory boundaries.
When is it a problem?
Despite high device peak specifications, delayed first tokens or sharp CPU/transfer increases may indicate bottlenecks elsewhere in the complete path.
Common beginner misconceptions
Detecting a GPU or NPU does not mean all operations are automatically offloaded, and low utilization does not necessarily indicate a hardware defect.
How to verify it yourself
Trace CPU preprocessing, copying, compilation, kernels, cache and response time for one request, and compare logged execution devices against the exact revision.
Conceptual explanation 02
Understand the CPU as a general-purpose baseline and memory host, not merely a slow substitute
CPU core count indicates independent execution resources, but does not mean every core can read the same model tensors efficiently. LLM matrix operations can use Advanced Vector Extensions (AVX, x86 vector extensions that process several numbers per instruction), ARM NEON, and matrix extensions. Results depend on whether the Runtime was built for those instruction sets and how physical cores, threads, and Non-Uniform Memory Access (NUMA, where memory-access time varies by socket) are arranged.
System RAM may be larger than consumer-GPU VRAM and useful for storing large quantized models, but capacity and bandwidth are distinct. Effective bandwidth varies with dual- or multi-channel memory, sockets, and page placement. Increasing threads indiscriminately can create competition for the same memory channels, stop tokens/s from improving, or increase scheduling overhead. Measure effective bandwidth alongside core and thread sweeps.
llama.cpp publishes a CPU vector backend, several other backends such as Metal, CUDA, HIP, and Vulkan, and CPU+GPU hybrid inference. This does not guarantee equal performance across every combination. Record the exact build flags and commit, BLAS backend, model GGUF and quantization, layer offload, and context. Placing layers that do not fit on the GPU on the CPU makes execution more likely, but PCIe transfers and CPU bandwidth can increase decode latency.
A CPU-only baseline is useful for isolating failures. If the same model, template, and small input are correct on the CPU but wrong on a new GPU backend, suspect the kernel and precision path before the artifact. Conversely, if both CPU and accelerator are wrong, examine the tokenizer, prompt, and model. The baseline does not need to be as fast as production; it needs a reproducible, simple path for confirming whether function and quality recover.
Why does this happen?
CPUs directly support diverse instructions and operating system features and host large system memory, which gives them advantages that accelerators lack.
When is it a problem?
If adding threads no longer improves speed, the memory controller saturates, or PCIe wait grows during offload, separate the CPU and memory paths.
Common beginner misconceptions
CPUs are not incapable of AI, nor does doubling the core count always double token/s.
How to verify it yourself
Pin runtime build·instruction set, physical cores·threads, NUMA·memory bandwidth, and layer offload, then measure token/s·power across thread counts.
Conceptual explanation 03
Verify a GPU's parallel kernels, VRAM, and vendor software stack as one combination
GPUs are designed so that many Arithmetic Logic Units (ALUs) and matrix units apply the same kernel to large amounts of data in parallel. LLM matrix multiplication exploits this structure, but small tensors, branch-heavy code, and frequent host synchronization may not keep the parallel units busy. Batching and prefill increase parallelism, whereas interactive decoding at batch size 1 may spend a larger share of time on memory access and kernel launches.
VRAM holds all or placed weights, activations, KV cache, kernel workspace, and allocator reservations. Do not conclude that a model fits merely by summing VRAM across GPUs. Tensor parallelism divides tensors within layers, while pipeline parallelism divides layer ranges; they introduce collective communication and stage waits respectively. Measure interconnects such as PCIe and NVLink, per-device shards, and peaks on the same topology.
NVIDIA CUDA, AMD ROCm, Intel XPU, and Apple Metal differ in driver·compiler·library and supported platforms. The latest official VLLM installation page describes the conditions for NVIDIA compute capability, AMD GPU architecture and ROCm, Intel XPU, and the Apple Silicon plugin on separate tabs. Support lists change by version, so do not approve your current exact GPU·OS based only on an old blog success story or a vendor name.
For a GPU candidate, first load a small officially supported model in a clean environment or a pinned container. Then widen to the target architecture and quantization, the longest context, and the target concurrency, saving the kernels, execution device, peak, and errors from the load log. Do not change the model artifact when changing the runtime wheel and driver. On failure, first determine how far you can roll back to the previous application container, rather than the previous image or driver, and retest with the same inputs.
Why does this happen?
Because GPU kernels must match the architecture and software binaries, and VRAM and interconnects must keep supplying data to parallel computation.
When is it a problem?
The model may load but still run slower than expected because of CPU fallback, inter-device communication, OOM on one device, or low batch utilization.
Common beginner misconceptions
A higher CUDA-core or stream-processor count, or more total VRAM, does not guarantee the same performance regardless of vendor, runtime, or workload.
How to verify it yourself
Find the exact GPU·OS·driver·runtime in the official matrix, and record the profiler's kernel·placement·copy·collective data and p50·p95.
Conceptual explanation 04
Evaluate NPUs by model export·operator·shape·power path, not TOPS
NPU stands for Neural Processing Unit. It is often integrated into laptop·mobile System on Chip(SoC) devices to handle continuous AI inference at low power. Advertised TOPS may represent peak operations under specific integer precision, sparsity, and vendor conditions. Actual latency and energy cannot be derived directly from that figure when model precision·operators or memory traffic·thermal conditions differ.
A framework model may need to be exported and compiled to Open Neural Network Exchange (ONNX, a model graph exchange format) or a vendor format. If the NPU compiler does not support attention and rotary embeddings, dynamic sequences, KV cache updates, or quant decomposition, compile errors or HETERO/CPU execution result. Even when the “use NPU” setting succeeds, if some core operations run on the CPU, overall token latency and power can differ from expectations.
The Intel OpenVINO 2026 NPU documentation lists supported properties, the default latency mode, and some HETERO conditions. For the exact compiled model, query the available devices, execution device, driver and compiler versions, and supported properties. NPUs from other vendors do not use the same properties, drivers, or model formats, so do not generalize the OpenVINO procedure as the standard for all NPUs.
NPU benchmarks record wall power and battery, cold compile·warm latency, input shape·batch 1, and target-model quality together. Compare against CPU·integrated GPU using the same model·task, distinguishing fallback-enabled results from target-device-only results. Check recovery after clearing the compile cache and compatibility of previously compiled artifacts after driver updates to establish an operational path rather than a one-off demo.
Why does this happen?
Because NPUs gain efficiency on a limited set of operator·precision and compiler paths, the key step is actually placing a supported graph on them.
When is it a problem?
Compile errors, static-shape requirements, CPU fallback, or limited shared memory can produce latency and quality unlike expectations based on TOPS.
Common beginner misconceptions
Do not assume that if an AI PC has an NPU, every local LLM runtime such as Ollama or vLLM uses it automatically without installation.
How to verify it yourself
Compile the exact model and check the execution device, operator partitioning, precision, driver version, wall power and whether CPU fallback occurs.
Conceptual explanation 05
Understand Cloud TPU as a system of ASIC, XLA, HBM, and slice topology
A Tensor Processing Unit (TPU) is an Application-Specific Integrated Circuit that Google designed for machine learning workloads. The official architecture documentation distinguishes the Matrix Multiply Unit (MXU), vector unit, and scalar unit within TensorCore, as well as High Bandwidth Memory. The matrix unit handles multiply-accumulate operations in a systolic array, while activations, softmax, control, and address calculations are handled by other units and the host. A TPU does not run an entire program on one unit either.
Graphs built with PyTorch or JAX pass through the Accelerated Linear Algebra (XLA) compiler to become TPU machine code. The host VM prepares input and manages compile·runtime and the device. Compile time can increase for unseen shapes or graphs, and dynamic Python control flow can interfere with device execution. Custom CUDA kernels written for GPUs cannot run unchanged on TPUs, so check framework·XLA support and the model implementation.
Multiple TPU chips form slices and topologies linked through Inter-Chip Interconnect (ICI). Model/data-parallel collectives depend on topology and mapping as well as chip count. Hosts, networks and input pipelines can also bottleneck multi-host execution. Record versions, slices/topology, TensorCore-versus-chip units and software versions rather than only a TPU count.
For cloud candidates, include quotas, regions, provisioning and compile time, storage and data movement, failures, checkpoints, and cost. Respect official cautions that the same code may need tuning to achieve similar efficiency across chip counts. Do not rank small local inference and large-scale training together. Measure real TPU jobs to determine whether matrix scale and repeated use offset compilation and distributed overhead.
Why does this happen?
TPU performance depends not only on the ASIC's internal units but also on how the XLA graph, host, HBM, and chip topology feed data and perform collective communication.
When is it a problem?
When repeated compilation, input starvation, or collective and topology mismatches occur, job steps slow down or stop even if chip peak performance is high.
Common beginner misconceptions
A TPU is neither a faster name for a consumer PC GPU nor a device that runs all Python code and CUDA kernels without modification.
How to verify it yourself
Check TPU version, slice, and topology, XLA compile and step traces, HBM, the input queue, and collective time in the same job revision.
Conceptual explanation 06
Calculate capacity, bandwidth, and compute ceilings in their own units
The capacity budget is the sum of actual loaded weight-artifact bytes, KV cache, activations/workspace, and operational headroom. Distinguish decimal GB from binary GiB, and subtract OS and other-process usage from unified memory. A safety line such as 90% is a starting point, not a universal law; replace it with actual peaks that include allocator overhead, bursts, and recovery. Repeated peaks at the longest context and target concurrency matter more than one successful load.
A bandwidth upper bound starts from effective bandwidth: read and write bytes for the same workload divided by execution time. Product-sheet theoretical bandwidth is an upper bound based on memory clocks and buses, excluding access patterns, caches, quantization unpacking, and contention. Following the effective-bandwidth view in NVIDIA’s CUDA guide, profile kernel read and write bytes and time, and calculate prefill and decode separately.
Compute ceilings divide the effective operation rate at a supported precision by operations per token. Tera in TOPS means 10^12 operations/s, and per-token quantities may use Giga Operations (GOPS, 10^9). But vendors may count multiply and accumulate differently and assume different sparsity, matrix shapes, or utilization, so do not directly divide figures from unlike specifications. Use the same profiler and benchmark definitions.
The roofline model shows that the upper bound is whichever of the memory ceiling and the compute ceiling is reached first, that is, the lower one. If observed values are much lower, investigate host transfer, kernel launch, unsupported fallback, queuing, or thermal limits. If observed values exceed the simple ceiling, check whether cache reuse was left out or whether GB and GiB, prefill and decode, or measurements at different batch sizes were mixed. The goal of the model is not accurate prediction but unit-consistent questions that can disprove assumptions.
Why does this happen?
Storage capacity, data transfer and computational throughput are distinct physical resources, and the workload is constrained by the lowest relevant supply rate.
When is it a problem?
If TOPS is high but tokens/s is low, or measured performance exceeds the calculated upper bound, recheck units, conditions, and effective bytes.
Common beginner misconceptions
Do not assume that enough VRAM means enough speed, or that dividing TOPS by parameter count gives an exact token/s.
How to verify it yourself
Collect loaded peak GiB, kernel read/write GB/s, effective operations by precision, and bytes and operations per token in the same run.
Conceptual explanation 07
Distinguish storage precision, inference precision, and operator fallback
INT4 weights can reduce file size and weight reads compared with FP16, but they require scales and zero points, group metadata, and dequantization. Activations and accumulation can mix FP16, BF16, FP32, or integers. Even if the hardware has a high INT8 TOPS rating, a runtime that cannot map the model's quantization format onto those matrix units may unpack the weights and use floating-point kernels. Report storage savings and compute acceleration as separate results.
BF16 uses 16 bits like FP16, but different exponent and precision allocations produce different numerical ranges and error characteristics. Nominal device support for BF16 does not establish kernels for every operator and generation path. Softmax, normalization, or sampling may remain at higher precision. Mixed precision may be an accuracy–speed design choice rather than an error, so check actual tensor dtypes using profiler output and runtime documentation.
As OpenVINO’s precision-control documentation explains, model storage precision and inference precision differ; integer types without hardware acceleration may use another execution precision. Do not generalize every detail to all runtimes, but consistently avoid inferring execution units from filenames alone. Record runtime options, compiled graphs, and device-capability queries together.
Evaluate precision candidates using the same prompt·seed·template across numbers, rare Korean text, JSON·tool schemas, long context, and safety refusals. Hold candidates that fail mandatory quality gates even if token/s and memory improve. If a new precision fails, revert only one of artifact·kernel·device to the previous baseline and retest. Preserve conversion recipes and source revisions·hashes for reproduction.
Why does this happen?
The weight storage format and the activation and accumulation dtypes used by operators can be decided separately depending on runtime and hardware capability.
When is it a problem?
Even if an INT4 file is small, inspect actual inference precision if kernel fallback causes slowness, or particular values trigger overflow or quality regressions.
Common beginner misconceptions
A Q4 in the model name or a device's INT8 TOPS does not mean every computation in the entire graph uses that precision.
How to verify it yourself
Inspect each operator's device and dtype in the compiled graph and profiler, then compare quality, memory, and latency with FP16/BF16 baselines on the same evaluation set.
Conceptual explanation 08
Translate the official compatibility matrix into an exact-version execution manifest
Compatibility is an exact tuple, not a broad label such as AMD GPU, NVIDIA GPU, or NPU. Record device architecture, firmware/driver, OS/kernel, runtime/compiler, framework/Python, container image, and model features together. Official AMD ROCm and vLLM documents distinguish GPU, ROCm, OS, and wheel requirements by version, and support changes by release. Record review date, URL, and the versions used.
Official production support, preview, community-enabled, and buildable from source are different states. Even if something ran once with a community patch, production risk is high without security updates, regression tests, and an incident support path. Conversely, absence from the official list does not mean it is technically impossible, but label experimental environments and operational approval levels separately so decision makers can see the cost.
Containers pin user-space dependencies but cannot capture the host driver, kernel, firmware, or physical topology. Record the image digest instead of the `latest` tag, and verify the host conditions required by the base libraries and runtime. Do not put tokens or passwords in image layers or command history. Manage model caches and compiled artifacts with their source revision, license, and hash, and do not mistake caches from different tests for the same result.
Manifest verification starts with importing a small model, then expands step by step to target-model loading, the longest input, target concurrency, and features. Support for structured output, quant, prefix cache, and tensor parallel may arrive at different times on different hardware backends. If an installation page has a separate feature matrix below “GPU support,” check both. Inspect logs for silent feature disabling·CPU fallback.
Why does this happen?
Because kernel binaries and compilers must match the device architecture, driver, and library ABI, and each backend implements features at a different pace.
When is it a problem?
If imports succeed but model loading, quantization kernels or distributed features crash or fall back, part of the compatibility tuple may be mismatched.
Common beginner misconceptions
Do not assume that using a container removes host driver requirements or that every GPU from the same vendor is officially supported by one runtime version.
How to verify it yourself
Write the exact tuple and image digest in the manifest, and link the official matrix and feature table, load logs, and a retest of the target workload.
Conceptual explanation 09
Separate the accelerator resources required by prefill·decode·batch·training
Prefill passes all input tokens through the attention and feed-forward layers to build the initial KV cache. Because many tokens can be grouped into matrices, it fills compute units relatively well and can reach high arithmetic intensity. Longer inputs increase Time to First Token and enlarge activation·temporary workspace. Even on the same GPU, prompt token/s and peaks differ between a 200-token question and a 30,000-token document, so split tables by input length.
Decode uses the existing cache to generate one token per step. At Batch 1, large weight reads and kernel launches may dominate. Continuous batching can reuse weights and improve aggregate throughput, but short requests may wait behind long ones and more cache blocks may worsen p95. Do not report per-user token/s and total-server token/s as the same metric.
Training and fine-tuning store and communicate gradients, optimizer states, and activations for backward passes in addition to forward computation. Do not assume that a model fitting in 16GiB for inference can be fully trained on the same device. Parameter-efficient tuning such as LoRA still needs activation, optimizer, and batch memory. Evaluate training candidates as a separate workload using step time, sample throughput, gradients, checkpoints, and failure recovery.
State the evaluation purpose in one sentence. The best device and runtime differ for one user’s interactive chat, four users’ API throughput, long-document prefill and adapter training. Fix input/output tokens, batch and concurrency for each stage, and inspect compute, memory and communication shares in a profiler. Do not mix different stages under the single name “LLM benchmark.”
Why does this happen?
Prefill has substantial parallelism along the token axis; decode uses repeated small steps; training adds gradients·optimizer state, so the same model uses resources differently.
When is it a problem?
If any one of long-prompt TTFT, batch 1 decode, concurrent-request throughput, or training OOM fails, the average token/s can hide the cause.
Common beginner misconceptions
A single tokens/s measurement or successful inference load does not represent all context, batch and training performance.
How to verify it yourself
Separate cold and warm states, prefill and decode, concurrency 1 and the target value, and training steps, and record tokens and samples, peaks, p50 and p95, and profiler ratios.
Conceptual explanation 10
Do not hide the parallelism and interconnect costs of multiple accelerators behind the device count
Tensor parallelism divides a layer’s matrices across devices and combines partial results through collective communication. Model weights can be distributed, but every token step may require communication such as all-reduce. Even with high on-device HBM bandwidth, slow inter-GPU PCIe links or networks can make communication a large share of small-batch decode time. Measure parallel size, shards, and collective bytes for the exact topology.
Pipeline parallelism splits groups of layers into stages. Memory can be distributed across stages, but each stage waits for the previous stage's output, and small micro-batches create idle gaps called pipeline bubbles. If large layers or a slow device are concentrated in one stage, that stage becomes a straggler the others wait for. Look at active·wait time and peaks per device·stage instead of average GPU utilization to find the imbalance.
With data parallelism, model replicas process different batches, and in training they synchronize gradients. Serving replicas must account for request routing, cache locality, health, and failure domains. Cloud TPU slices and GPU clusters differ in interconnect and topology representation, so collective paths differ even with the same device count. Check actual message sizes and collective traces, not just the vendor's peak interconnect figure.
Increase scale-out tests in stages such as 1 → 2 → 4 devices, recording throughput gains alongside increases in latency, power, and cost. A 1.6× speedup with two devices may reflect the workload and communication rather than a failure, but evaluate the benefit against the target cost. Preserve the single-device baseline and previous parallel configuration. Test recovery of the same checkpoints and requests after a node failure, collective timeout, and restart.
Why does this happen?
Because distributed computation exchanges partial tensors and state between devices, and the slowest stage or device limits when the whole step completes.
When is it a problem?
If adding devices barely raises throughput or p95 spikes, check collectives, pipeline bubbles, shard imbalance, and the network.
Common beginner misconceptions
Summing VRAM and TOPS across devices does not give an exactly proportional model size and speed free of communication overhead.
How to verify it yourself
Compare shard·collective bytes, stage active·wait time, interconnect utilization, throughput·p95·power, and failure recovery on 1 device, 2 devices, and the target number of devices.
Conceptual explanation 11
Measure power·temperature·clock conditions between peak and sustained performance
Processors adjust clocks within temperature and power limits. Laptop GPUs·NPUs and desktop GPUs may share a silicon name but differ in sustained performance because of configured power and cooling. If clocks fall after the first 20 seconds of fast generation, a short benchmark does not represent real meeting summaries or long batches. After warm-up, repeat for the target duration and save token/s over time.
The chip power reported by device software may not be total system power. Including CPU host, DRAM, fan, storage, and power supply losses requires a reliable wall measurement. When calculating energy per token or per job, also record input and output tokens and whether the job succeeded. Compare the cost of a slow, low-power device with a fast device that has high idle and peak power using the actual request rate and duty cycle.
Check drops in tokens/s, clock changes, and rising temperatures on the same timeline to identify thermal throttling. Error correction, device resets, and compiler crashes may also appear under prolonged operation or high temperatures. Changes that force fan settings or raise power limits affect noise, lifespan, safety, and warranty conditions, so the educational site does not prescribe them as universal commands. Test conservatively using vendor tools and equipment operating rules.
Use sustained approval criteria rather than peaks, for example p95 and minimum throughput over 30-minute repeated runs, maximum temperature, wall energy, and zero errors. Specify this duration as a workload measurement condition, not as lesson duration. After cooling changes or driver updates, rerun the same long-input and concurrency set and check whether returning to the previous power profile restores performance and stability.
Why does this happen?
Devices change their clocks dynamically to stay within power and temperature limits, so supply rates during short peaks and sustained workloads can differ.
When is it a problem?
If initial speed falls over time in tokens/s, or resets and errors occur, check temperature, clocks, power and cooling conditions.
Common beginner misconceptions
There is no guarantee that a product's peak TOPS or one fast response will sustain the same performance, power, and noise all day.
How to verify it yourself
Over sufficiently long repeated runs, record tokens/s over time, clocks, temperature, device and wall power, and errors. Retest under the same cooling and room conditions.
Conceptual explanation 12
Include data boundaries, cost, availability, and operational responsibility in the local vs. cloud choice
Local CPUs, GPUs, and NPUs can keep inputs on devices inside the organization, but that alone does not make a system secure. Check model downloads, telemetry, remote management, shared accounts, and log paths. Decide who can see caches and prompts in device memory and on local disks, and how they are deleted when someone leaves, a device is lost, or it goes in for repair. Do not keep sensitive source text in benchmark logs; use anonymized normal and boundary sets.
Cloud TPU and GPU provide immediate access to large hardware but have region and quota limits, VM/slice provisioning, storage and data egress, network latency, and service limits. Include compilation, idle time, attached storage, traffic, and operator labor, not just hardware hours. Local purchases add depreciation, power, cooling, racks, noise, spares, and downtime. Compare cost for the same workload without mixing periods or utilization rates.
Availability is about failure domains and recovery time, not the reliability of a single device. One local workstation is simple, but if it fails, everything can stop; a cloud slice can be replaced, but may run into capacity shortages or a region outage. Keep checkpoints·model artifacts and config in a different failure domain, and test whether you can restore them from the exact manifest once you obtain a new device.
Purchase and cloud approval records include data classification, allowed regions and networks, owners, monthly and per-workload cost limits, support contracts, and exit procedures. Put the fastest tokens/s candidate on hold if it violates data boundaries or recovery targets. Conversely, choosing not to build a more complex cluster can be technically sound when a slower local CPU meets traffic and privacy requirements.
Why does this happen?
Because a real service depends not only on devices but also on data movement, accounts and networking, cost, and failure recovery resources, and these conditions limit what is actually usable.
When is it a problem?
Cloud quota or network problems, a single-device failure in a local setup, unexpected costs, and log exposure cannot be recovered from with hardware benchmarks alone.
Common beginner misconceptions
Local does not automatically mean safe and free, cloud does not automatically mean scalable and recoverable, and the fastest device does not necessarily have the lowest total cost.
How to verify it yourself
Record data flow, failure domain, quota and region, wall energy and cloud bills, and restore procedures on the same workload and period basis.
Conceptual explanation 13
Diagnose load failures, OOM, slow responses, and quality regressions from different first evidence
For load failures, start with the exact model architecture and quantization, runtime features, driver and binary compatibility, artifact integrity, and the memory allocation log. Clearing the error message and blindly upgrading packages loses the original failure condition. Check whether a small officially supported model loads on the same backend to separate the device and driver path from support for the target model. Preserve the current environment manifest and a rollback image before applying a community patch.
For OOM, record device·host peaks at load, prefill, decode, and concurrency moments rather than looking only at file size. Reduce context·batch·sequence to small working values and increase them one at a time. Lowering quant or enabling offload at the same time introduces new variables: quality and transfer. Protect new requests with an admission limit, and confirm that the failed request recovers at a small baseline and on the previous backend.
For slow responses, separate CPU preparation, compilation, host-device copies, kernels, collectives, cache/queues and thermal timelines. Utilization alone can miss silent fallback and unsupported fused kernels. Determine whether only cold requests are slow, whether prefill or decoding is affected and where concurrency changes behavior. Address the longest profiler segment one item at a time before buying a larger device.
If output quality changes, confirm that the model, tokenizer, template, and sampling are the same, then compare operator devices, inference precision, and quant artifacts. Do not conclude that runtime kernel differences are the cause; test whether the same failing input recovers on a CPU or higher-precision baseline. In the runbook, record each symptom’s first logs and metrics, safety limits, change order, previous container and artifact, and exit gate so the next owner can reproduce the same procedure.
Why does this happen?
Because load, memory, latency, and quality problems can arise in different system layers, which means they must be isolated starting with the cheapest evidence that fits the symptom.
When is it a problem?
Restarting, upgrading, and changing quant all at once may succeed briefly, but the cause is lost and the same workload fails again.
Common beginner misconceptions
Do not assume that every accelerator failure is a driver problem or that switching to a device with more VRAM·higher TOPS will fix it automatically.
How to verify it yourself
Preserve the exact failing inputs and manifest, and compare one variable at a time against a baseline of a small supported model, short context, concurrency 1, and high precision.
Conceptual explanation 14
Approving a candidate based on cold·warm·prefill·decode·concurrency on the same workload
Build the evaluation table from the workload, not candidate names. Fix the exact model, revision, and artifact, tokenizer and template, normal, boundary, and failure inputs, input and output tokens, sampling, batch and concurrency, and essential quality. If devices support different quants and the exact same artifact cannot be used, disclose the difference and include a high-precision baseline alongside task quality. Do not change prompts or target latency per candidate after seeing results.
Cold measurements include process startup, model loading, compilation, and the first request; warm measurements cover repeated requests with caches ready. Separate prefill token/s, TTFT, decode token/s, End-to-End latency, and throughput at target concurrency. Record p50, p95, maximum, success rate, and actual tokens, not just averages. Measure power, temperature, and clock throttling under sustained requests so burst specifications are not presented as sustained performance.
The first lab passes a candidate only when memory calculations, official compatibility, and execution logs are all present. The second lab shows the gap between memory and compute ceilings and observed values. Passing in the browser is not hardware evidence; replace the inputs with actual profiler values. Even if another device's results look good, do not approve it on speed ranking if task accuracy, format, or safety gates fail.
If p95 spikes after a runtime update, do not simultaneously change model·quant·driver. Restore a small successful baseline with the previous container, same model, and failing request, then increase context and concurrency one at a time. Record symptoms, initial device·copy·kernel·queue metrics, admission limits, previous images·artifacts, and recovery conditions in the runbook. As with the 31-course quality gates, equipment promotion should remain on hold while verification gaps exist.
Why does this happen?
This is because device advantages vary with compile and cache state, prompt phase, batch, and workload quality, so they cannot be reproduced as a single number.
When is it a problem?
High average tokens/s does not make a candidate suitable if cold start, p95, quality, power or target concurrency fails.
Common beginner misconceptions
A single short benchmark or vendor demo does not replace purchase and deployment approval for your model, runtime, and tasks.
How to verify it yourself
Using a fixed manifest, repeat cold and warm, prefill and decode, concurrency, and quality and power tests. After rolling back to the previous backend, retest the same failing inputs.
CONCRETE CASES
Check concepts in different situations
Before memorizing definitions, compare how these concepts appear on a personal PC and in real work.
Case 1 · An accelerator is one stage in the execution path prepared by the CPU
Even if the laptop's Task Manager shows an NPU, the model may run only on the CPU or GPU if the selected LLM runtime does not support the NPU backend and model operators.
Key points to check here: The CPU handles control, preprocessing, and I/O; the accelerator executes supported tensor operations.
Case 2 · Calculate memory capacity, bandwidth, and bytes moved before compute
If a workload effectively reads the equivalent of 8GB of weights for every token at an effective bandwidth of 400GB/s, the simple memory ceiling is about 50 token/s, and raising TOPS alone does not change that ceiling.
Key points to check here: Capacity is how much can be held, and bandwidth is how much can be moved per second.
Case 3 · Precision, operators, compilers, and runtimes determine the actual support path
Even if an INT4-weight model fits in NPU memory, if the compiler does not support dynamic shapes or a required attention operator, compilation may fail or CPU fallback may increase latency.
Key points to check here: Distinguish storage precision from inference precision.
Case 4 · Distinguish CPU, GPU, NPU, and TPU by role and software ecosystem
Personal document summarization can compare CPU·Apple GPU·laptop NPU candidates, but for training·serving hundreds of users, the network·compiler·operations tooling of datacenter GPUs or TPUs becomes the more important factor.
Key points to check here: CPU-only and hybrid offload are also valid designs.
Case 5 · Approve equipment with the same workload benchmark and rollback
Even if average tokens per second is high on the new GPU, hold the production candidate if p95 TTFT at the target concurrency or JSON quality fails, or if recovery to the previous CPU baseline does not work.
Key points to check here: Record effective values and user-facing metrics, not peak specifications.
CHAPTER 1 / 5
An accelerator is one stage in the execution path prepared by the CPU
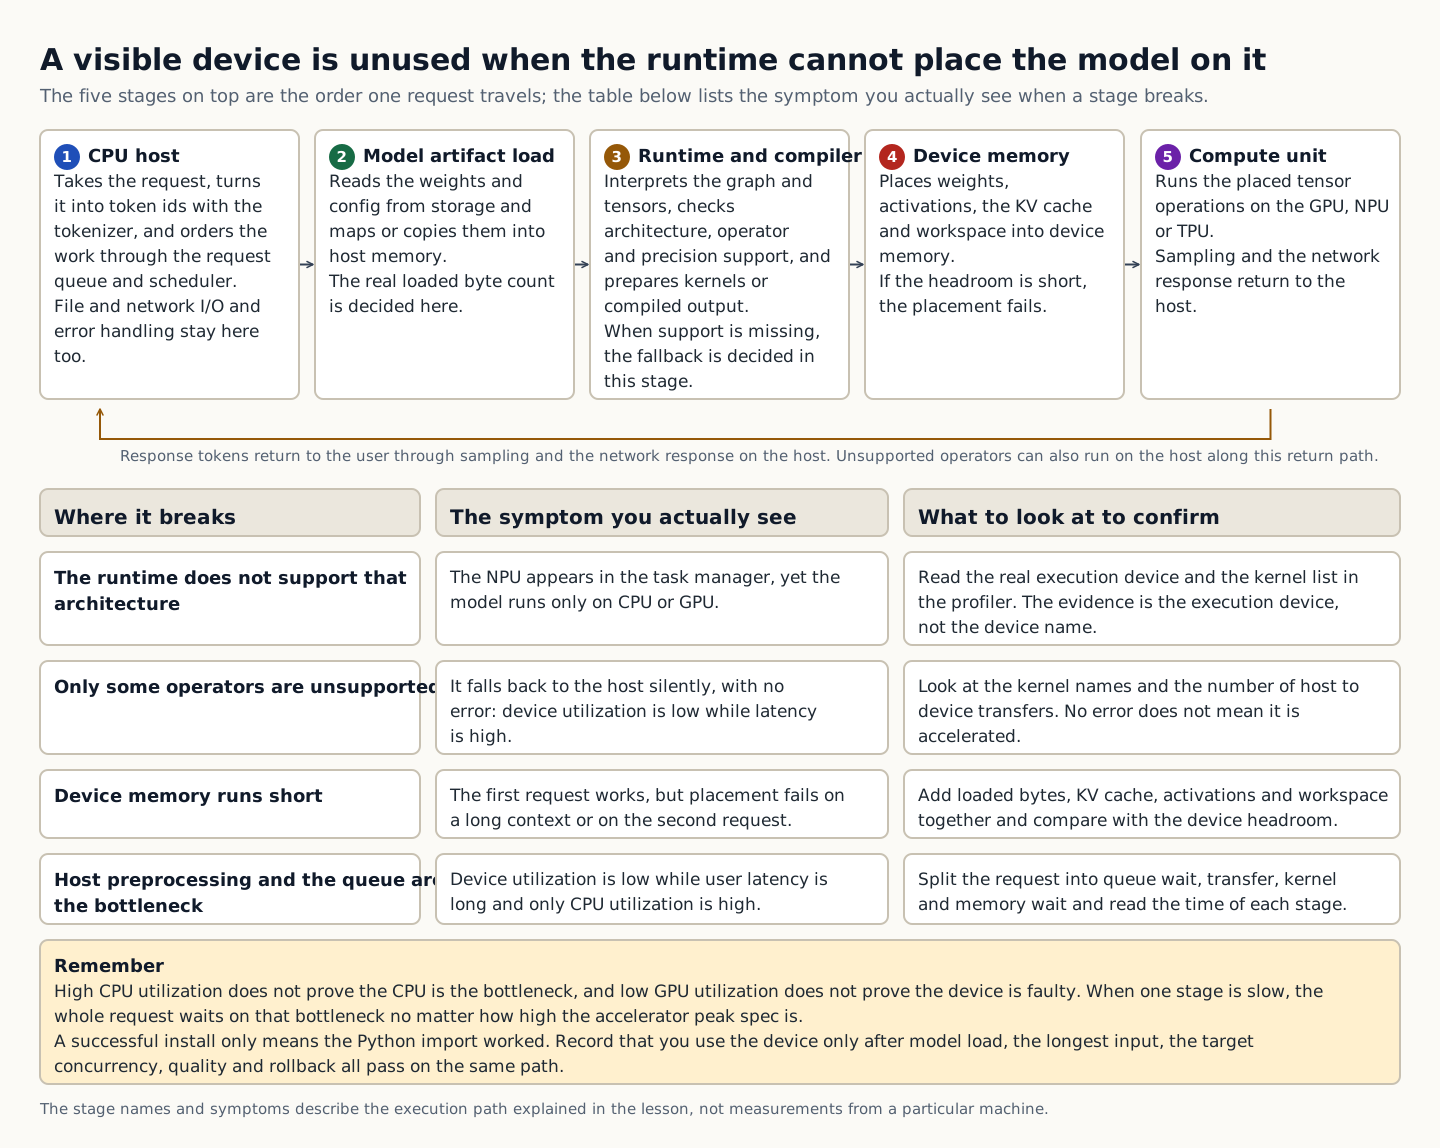
The Central Processing Unit (CPU) provides general control, including the operating system, file and network I/O, tokenizer, scheduler, and error handling. Graphics Processing Units (GPU), Neural Processing Units (NPU), and Tensor Processing Units (TPU) are designed for highly parallel matrix multiplication or selected tensor operations. An accelerator is not an independent magic box; it is a system component receiving CPU-prepared data and commands through drivers and runtimes.
Execution starts by reading model artifacts from storage and mapping or copying them into host memory. The runtime interprets graphs and tensors, prepares device kernels or compiler outputs, and places weights, activations and cache in device memory. Tokenization and request queues may remain on CPU; even with matrix multiplication on GPU, sampling, network responses and unsupported operators may execute on the host. A slow segment makes the whole request wait regardless of accelerator peak specifications.
GPUs excel at having many threads perform the same kind of operation in parallel and at exploiting high device-memory bandwidth. Domain-specific accelerators such as NPUs and TPUs optimize supported operations, precision, and dataflow more narrowly, which can improve power efficiency or large-scale matrix throughput. In exchange, mismatched dynamic shapes, new operators, custom kernels, or framework versions can cause compilation failures or fallback to another device. Generality, efficiency, and software maturity trade off against one another.
The architecture diagram shows the path a request takes through the CPU host, runtime and compiler, device memory, and compute unit before returning as a response. When checking directly, use a profiler to confirm the actual execution device, loaded bytes, kernel list, and host-device transfers, not just the device name. Do not conclude that the CPU is the bottleneck because CPU utilization is high, or that the device is faulty because GPU utilization is low; look at queue, transfer, kernel, and memory wait times together with the time spent in each request stage.
How to read the figure An accelerator is one stage of the whole path. Even when the device is visible, if the runtime cannot place the model and its operators on it, execution falls back to the CPU without any error.
To recap the key points
The CPU handles control, preprocessing, and I/O; the accelerator executes supported tensor operations.
Even if a device is present, it goes unused if the software cannot place the model graph on it.
How this connects in practice
Even if the laptop's Task Manager shows an NPU, the model may run only on the CPU or GPU if the selected LLM runtime does not support the NPU backend and model operators.
CHAPTER 2 / 5
Calculate memory capacity, bandwidth, and bytes moved before compute
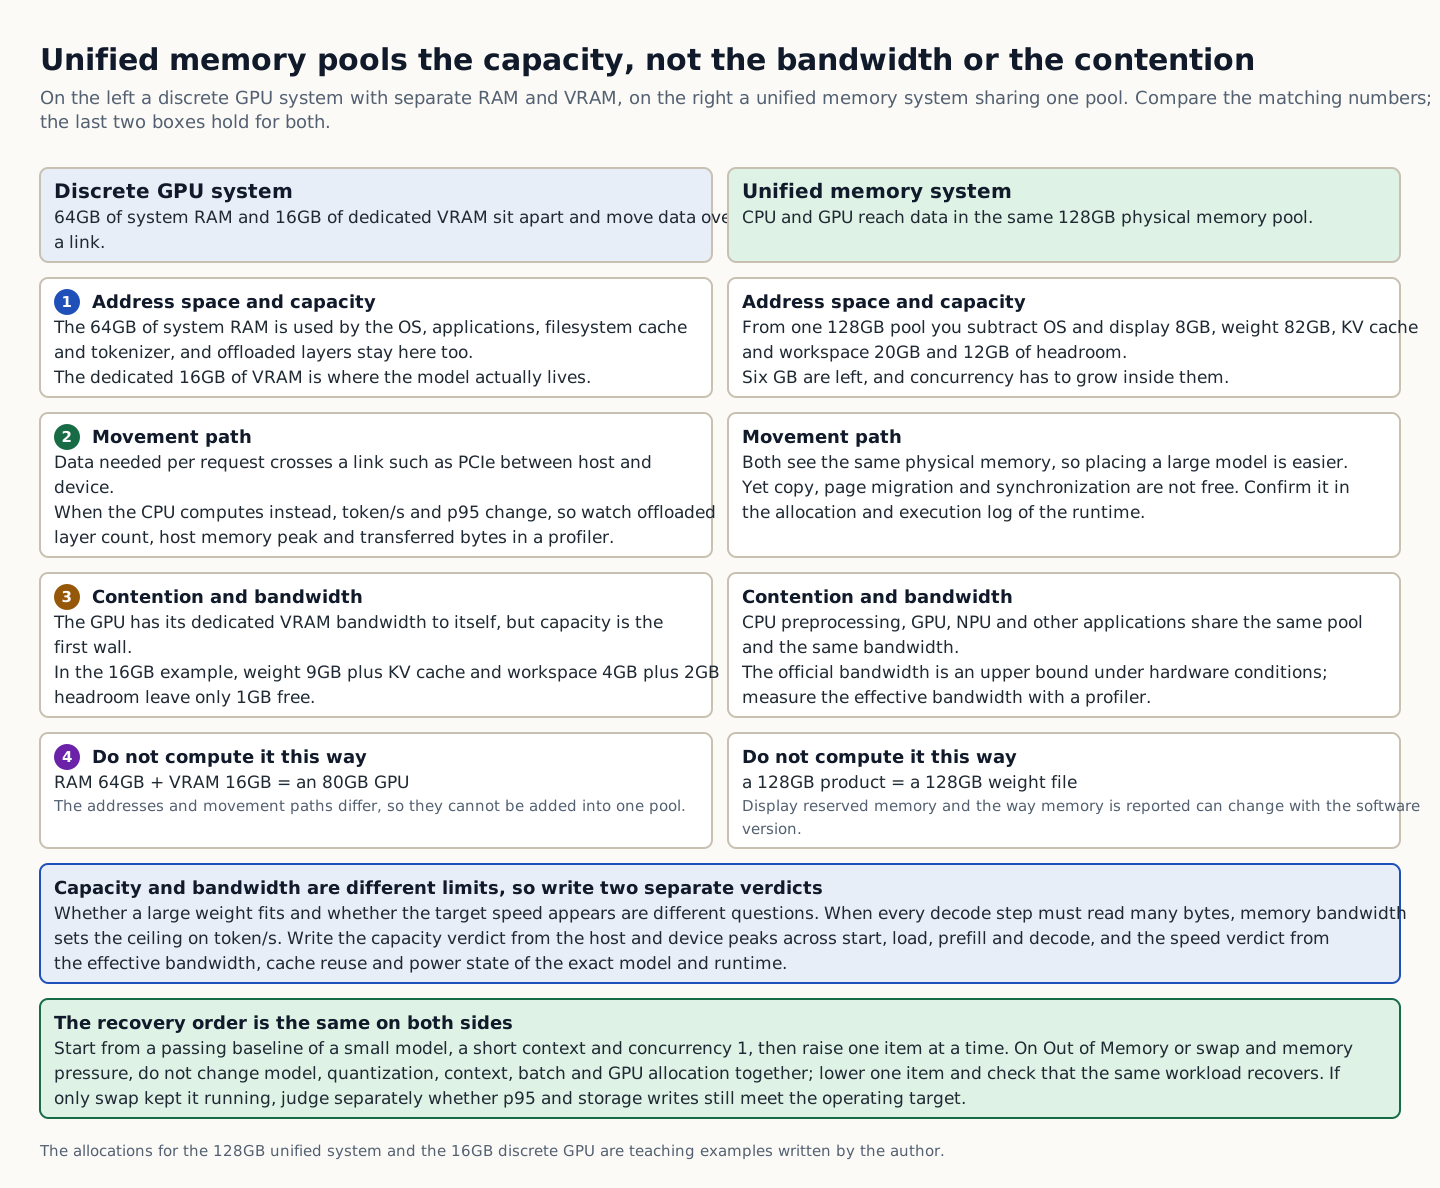
Memory capacity is the number of bytes held at once; memory bandwidth is the number read and written per second. Even if a 16GiB GPU holds a 12GiB artifact, adding KV cache, activation, graph·workspace, and allocator headroom may cause Out of Memory(OOM) with long context or a second request. Conversely, a model may fit comfortably in 64GiB system RAM but generate tokens slowly because low CPU memory bandwidth makes repeated weight reads take longer.
Small batches in decoder generation tend to be memory-bound because each token step reads large weights. As a simple approximation, reading 8GB per token at an effective bandwidth of 400GB/s gives a memory ceiling of 400÷8=50 token/s. This simplifies cache hits, quant kernels, shared weights, and actual access patterns, but it explains why a device with twice the peak TOPS is not always twice as fast. NVIDIA's official CUDA best practices also recommend measuring effective bandwidth from actual read/write bytes and time, not only theoretical values.
Prefill can batch matrix operations across many input tokens, so its arithmetic intensity (computation per byte moved) can be higher than that of decode. Larger batches can improve weight reuse and throughput but also grow KV cache and queues, which can lengthen an individual user's Time to First Token (TTFT). Measure prefill and decode, concurrency 1, and the target batch separately on the same model to translate “this GPU is fast” into real usage conditions.
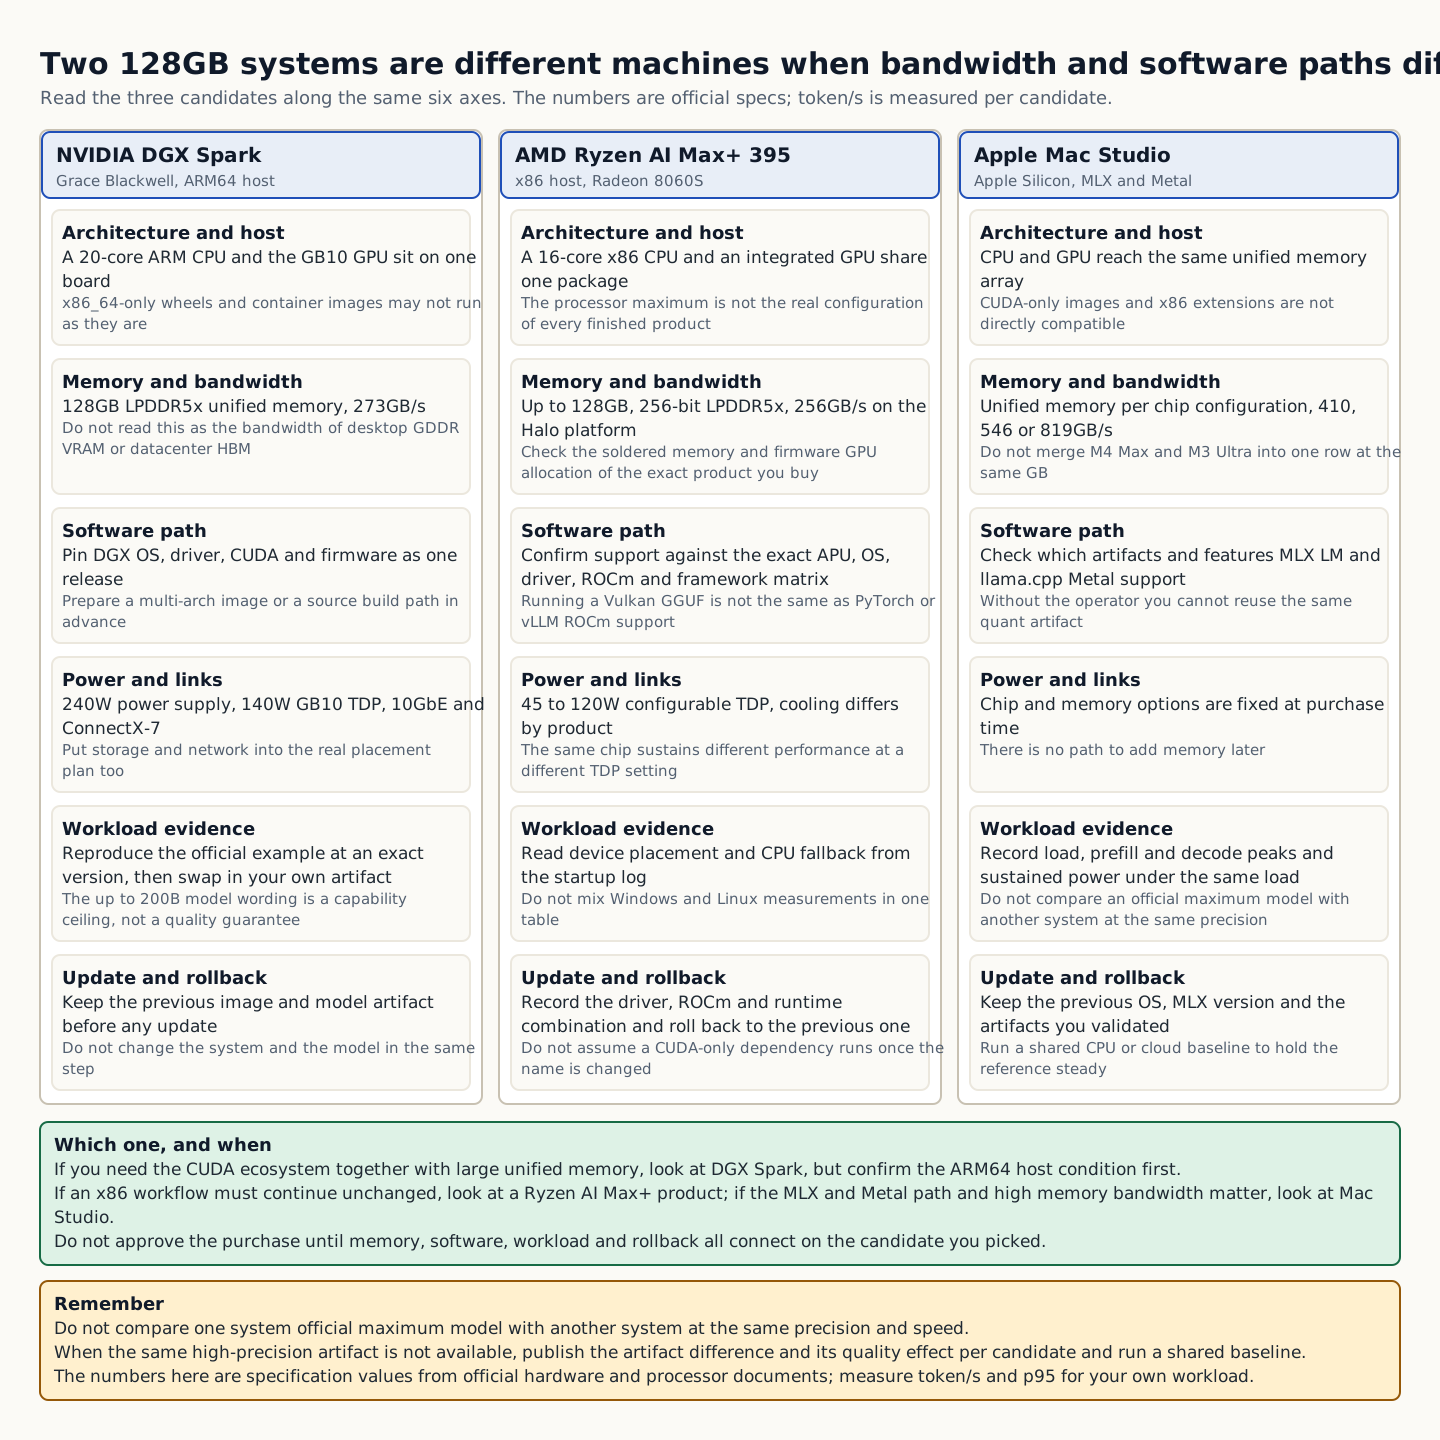
Host-device offload can solve a capacity problem, but if every layer or selected weights move across PCI Express (PCIe, the standard connecting the CPU to expansion devices), that link, which is slower than the device's internal bandwidth, can become the bottleneck. The unified memory that MLX uses on Apple Silicon lets the CPU and GPU access arrays in the same memory pool and reduces explicit copies, but capacity, bandwidth, concurrent access, and runtime support limits do not disappear. Whatever the physical architecture, verify the bytes actually moved and the wait times with a profiler.
To recap the key points
Capacity is how much can be held, and bandwidth is how much can be moved per second.
Transfers between host and device take a different path from access within the device.
How this connects in practice
If a workload effectively reads the equivalent of 8GB of weights for every token at an effective bandwidth of 400GB/s, the simple memory ceiling is about 50 token/s, and raising TOPS alone does not change that ceiling.
CHAPTER 3 / 5
Precision, operators, compilers, and runtimes determine the actual support path
Floating Point 32-bit (FP32), FP16, Brain Floating Point 16-bit (BF16), integer 8-bit (INT8) and INT4 change byte requirements, range, accuracy and hardware units. An INT4 model file does not mean activations and accumulation also use INT4. Mixed-precision kernels may store weights at low bit widths while performing some calculations in FP16, BF16 or FP32. Therefore, do not directly convert a product's 'N TOPS INT8' rating into actual FP16-model throughput or LLM tokens per second.
Operators are graph operations such as matrix multiplication, normalization, attention, and activation. Even with low-precision matrix hardware, missing architecture or fused-attention support in the runtime can cause fallback to general kernels, CPU, or another device. Dynamic shapes, sequence length, quant groups, and cache formats also affect compilation. OpenVINO NPU documentation separately describes device properties and partial HETERO support, so query `execution_devices` and supported properties for the exact model.
The compiler transforms framework graphs into device kernels and memory plans. TPU workloads use XLA (Accelerated Linear Algebra), separating host code from TPU execution. Long compilation or recompilation after shape changes can increase first-request latency. GPU CUDA, ROCm, or Metal kernels and libraries must also match model code and drivers; binary compatibility may require a new environment or official container.
Verify support in four stages, rather than relying on a marketing page. Check that the OS recognizes the device, the driver and runtime support the exact architecture, the model, quantization and operators appear in the feature matrix, and logs and profilers show the actual execution device and kernels. Successful installation only means Python imports work; it does not mean model loading, longest inputs, target concurrency, quality and rollback have passed.
To recap the key points
Distinguish storage precision from inference precision.
Read support matrices for the exact device, OS, driver and runtime version.
How this connects in practice
Even if an INT4-weight model fits in NPU memory, if the compiler does not support dynamic shapes or a required attention operator, compilation may fail or CPU fallback may increase latency.
CHAPTER 4 / 5
Distinguish CPU, GPU, NPU, and TPU by role and software ecosystem
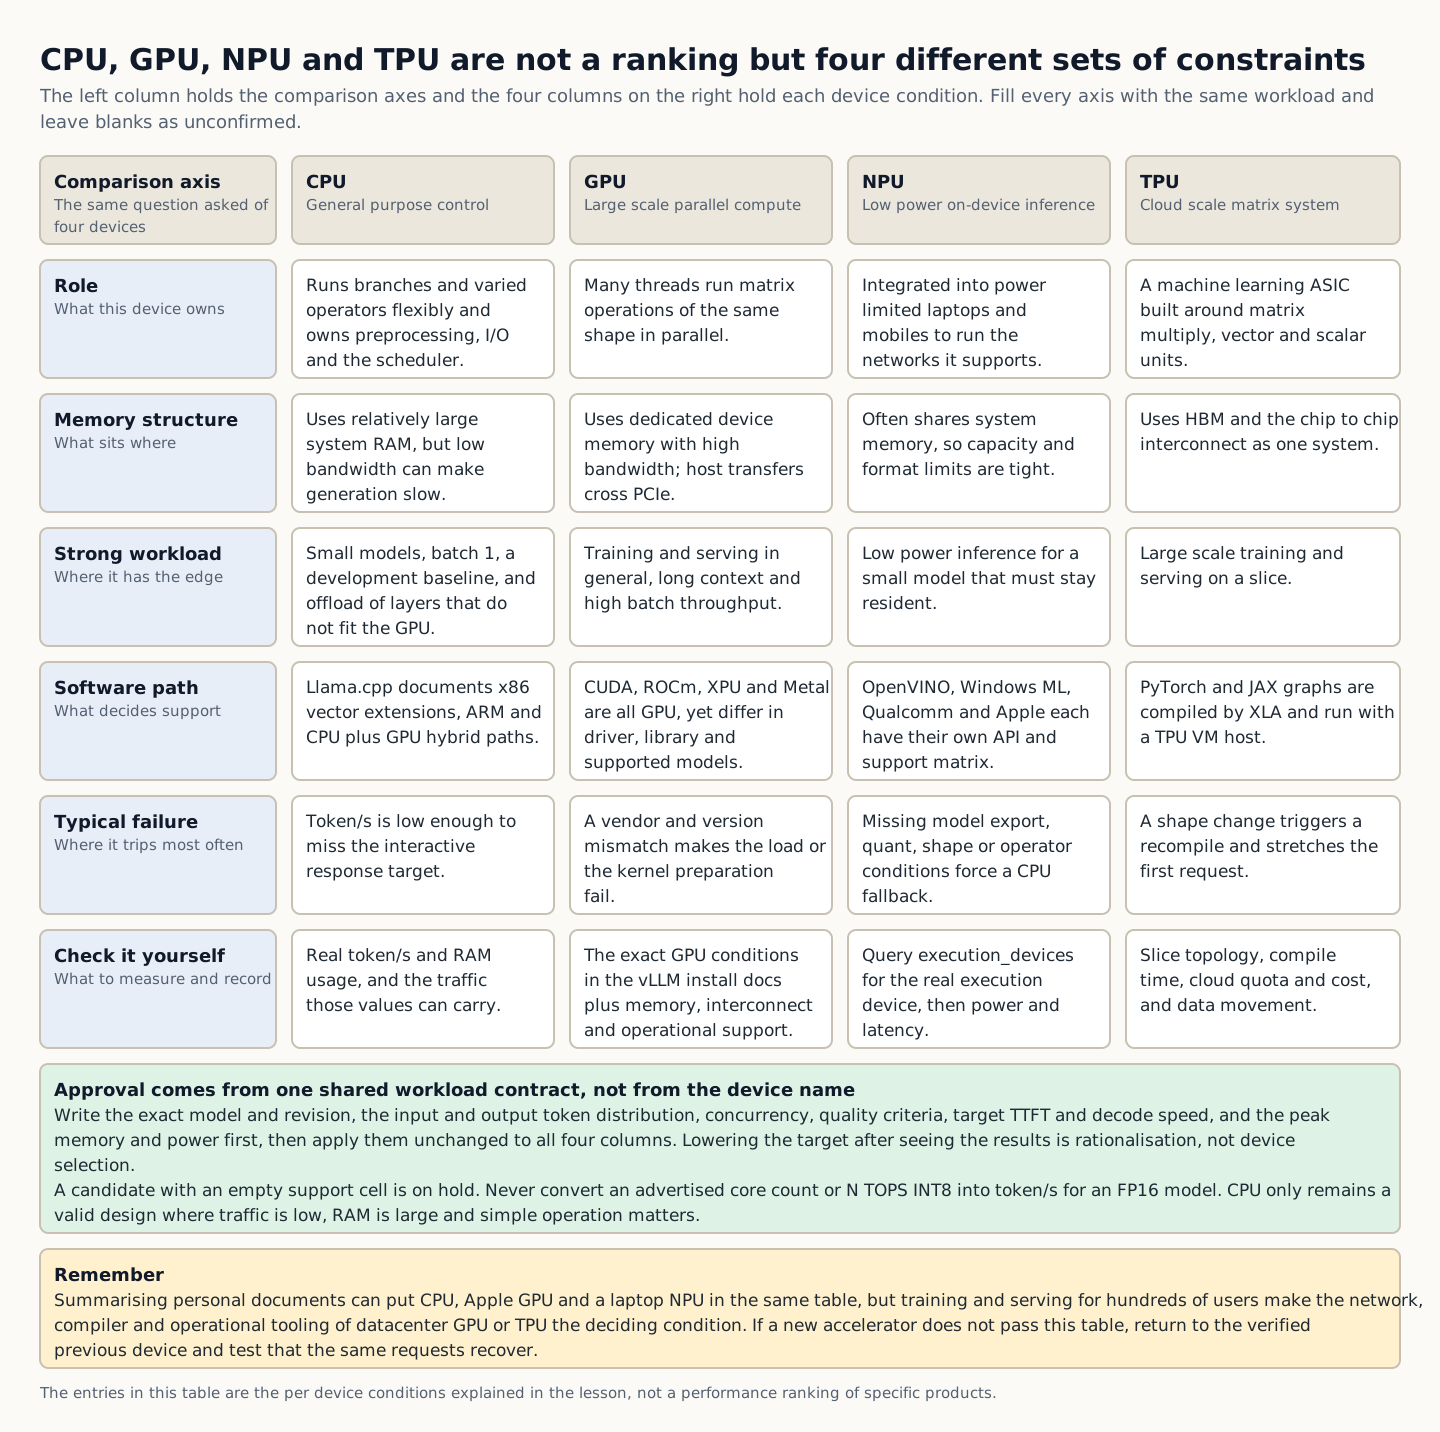
CPUs flexibly execute branches and many operators and can use relatively large system RAM, making them useful for small models, batch 1, development baselines, and offloading layers that do not fit on a GPU. Llama.cpp documents x86 vector extensions, ARM, multiple GPU backends, and CPU+GPU hybrid paths. CPU-only is not always the wrong choice: where traffic is low, RAM is large, and simple operations matter, accepting slower token/s may still suit cost and recovery needs.
GPUs are strong in matrix operations, high memory bandwidth, and a broad training and serving ecosystem. NVIDIA CUDA, AMD ROCm, Intel XPU, and Apple Metal are all "GPUs," but they differ in drivers, OS, libraries, and supported models. The official vLLM installation documentation also separates exact GPU and software requirements by vendor, so do not approve a candidate based only on a generic "GPU supported" statement. Consumer and datacenter GPUs also differ in memory, error correction, interconnect, and operational support.
NPUs are often integrated to efficiently execute supported neural networks in power-constrained devices such as laptops and mobiles. However, not every local LLM runtime uses an NPU automatically; model export, quantization, static·dynamic shapes, and operator coverage matter. Intel OpenVINO, Windows ML, and Qualcomm·Apple execution paths have different APIs and support matrices. Check your model’s execution device, power·latency, and CPU fallback rather than relying on advertised TOPS.
Google Cloud TPUs are Application-Specific Integrated Circuits (ASICs) for machine learning, built as a system of matrix multiply units, vector and scalar units, High Bandwidth Memory (HBM), and chip-to-chip interconnects. PyTorch and JAX graphs are compiled with XLA, and the TPU VM host and devices operate together. Installation differs from a general-purpose GPU plugged into an ordinary PC, and the workload contract must cover slice topology, compilation, cloud quotas and costs, and data transfer.
How to read the figure A device class is a set of constraints, not a ranking. Apply the same workload contract unchanged to all four columns and hold any candidate whose support cell stays empty.
To recap the key points
CPU-only and hybrid offload are also valid designs.
Despite similar names, NPUs and TPUs differ in platform and programming model.
How this connects in practice
Personal document summarization can compare CPU·Apple GPU·laptop NPU candidates, but for training·serving hundreds of users, the network·compiler·operations tooling of datacenter GPUs or TPUs becomes the more important factor.
CHAPTER 5 / 5
Approve equipment with the same workload benchmark and rollback
Define a workload contract before benchmarking: exact model, revision, artifact, quantization, tokenizer, template, input and output token distributions, batch size, concurrency, normal, boundary, and failure quality, target TTFT, decode speed, throughput, and maximum memory, power, and cost. Use identical conditions for CPU, GPU, NPU, and TPU candidates where possible and disclose unavoidable compiler or dtype differences as separate variables. Lowering targets after results rationalizes outcomes rather than selecting equipment.
Separate and repeat cold starts including warm-up and compilation, warm requests with a ready cache, prefill and decode, and runs at concurrency 1 and at the target value. Record not only averages but also p50, p95, maximum, actual output token counts, energy, and errors. Derive effective bandwidth from read and write bytes and time, and check device utilization in a profiler. High utilization does not by itself mean a good user experience; if queues are long or memory is thrashing, explain latency and failures together.
Failure tests include a wrong model shape, context just short of running out of memory, bursts above the target, and runtime updates. When a failure occurs, check that admission limits protect the system without losing input, that compile and load errors are clear, and that CPU fallback does not silently degrade performance. When changing GPU drivers or NPU compilers, do not change the model and quant at the same time; reproduce the regression with the same failing input as on the previous version.
The final approval table includes the exact device ID, firmware and driver, operating system, runtime, compiler, and container digest, model manifest, execution device and precision, workload and results, known limitations, cost, and rollback. If the new accelerator does not pass the gate, revert to a smaller model, a verified quant, the CPU baseline, or the previous device, and test whether the same requests recover. The operable choice is not the “latest accelerator” but a combination that can be measured and recovered.
To recap the key points
Record effective values and user-facing metrics, not peak specifications.
Do not change the backend, driver, and quantization at the same time.
How this connects in practice
Even if average tokens per second is high on the new GPU, hold the production candidate if p95 TTFT at the target concurrency or JSON quality fails, or if recovery to the previous CPU baseline does not work.
INTERACTIVE LAB 1 / 2
Lab 1 · Accelerator execution path approval lab
Enter values in the browser and check the execution results and the failure and recovery paths. No commands are ever sent to real equipment or the NAS.
Translate an accelerator name into an actual execution path and compatibility gates
Check model bytes, runtime headroom, official software support, fallback, and rollback together. By default, the memory and operator gates intentionally fail.
Situation
A candidate was approved merely because its 12GiB of weights fit on a 16GiB device, but long inputs cause OOM and two operators fall back to the CPU.
Goal
Judge the requirements and transfer costs along the host → runtime → device memory → kernel path in one ledger.
Prerequisites
Prepare the exact model and artifact bytes, the peak for the longest input, the device, OS, driver, and runtime support table, and the execution device from the profiler.
Success criteria
The 90% memory safety line, official support, zero fallback, precision·operator compatibility, and restoration of the previous backend all pass.
Enter the candidate device, the actual weight, cache, and workspace, and device memory.
Reflect the transfer volume and fallback counts confirmed with the profiler, along with official support·precision·rollback evidence.
Compatibility gate run Then fix the failure reasons one at a time and reassess with the same model and inputs.
Limitations: The transfer-time lower bound simplifies GiB versus GB, protocol effects, page migration and overlap. It does not guarantee infinitely fast unified memory or an architecture with no copying. Use an actual profiler and power meter.
INTERACTIVE LAB 2 / 2
Lab 2 · Bandwidth and compute upper-bound diagnosis lab
Enter values in the browser and check the execution results and the failure and recovery paths. No commands are ever sent to real equipment or the NAS.
Approve benchmarks with memory·compute ceilings and user metrics
Derive two upper bounds from bytes and operations per token and effective supply rates for the same execution. Then assess actual decode performance, p95 TTFT, and the measurement contract together.
Situation
The new device has high peak TOPS, but the report claims it is “twice as fast” after measuring only one short generation.
Goal
Compare the simple ceiling reached first, memory or compute, with user-perceived TTFT·token/s under the same gate.
Prerequisites
Prepare the same model·revision·quant·prompt·output·concurrency, per-token bytes·operations from the profiler, effective bandwidth·compute, and quality results.
Success criteria
Measurements pass the predefined targets and both physical sanity checks, with evidence of at least three repetitions, identical contracts and rollback.
Enter profiler estimates of weight reads·operations per token and effective bandwidth·compute.
Before seeing results, set the target decode speed and p95 TTFT, then enter measurements from the same workload.
Measurement contract verdict to address hold reasons, then rerun cold, warm and target-concurrency cases in separate tables.
Limitations: The bandwidth ÷ bytes and compute ÷ operations formulas are educational upper bounds for small-batch decode. They simplify prefill, cache hits, quantized kernels, speculative decoding, batch reuse, and communication, so they do not replace actual profiling and quality measurements.
KEY TERMS
Key terms in this unit
Memory bandwidth
A metric for the amount of data a device can read from and write to memory per second, distinguishing theoretical values from effective values under real workloads
Operator
Unit of computation, such as matrix multiplication, attention, or normalization, that makes up a model graph and must be supported by the runtime and device
TOPS
Tera Operations Per Second: a peak metric expressing trillions of operations per second at a specified precision and under specified conditions, distinct from actual tokens/s.
Fallback
Behavior in which unsupported operations or device paths run on the CPU or another backend instead, preserving functionality but changing latency and memory
UNIT WORKBOOK
Exercises and worksheets for applying concepts to new situations
Start by checking basic principles, then expand to practical workplace decisions. After submitting an answer, you can see why every option is correct or incorrect, not just the correct answer.
Basic Question 1
What is the most accurate description of the execution path of an LLM request using an accelerator?
Basic Question 2
You plan to place 12GiB of weights and 4GiB of cache·workspace on a device with 16GiB available. What is the verdict when the 90% safety line is applied?
Apply Question 3
An INT8 model compiles for a laptop NPU, but the profiler shows two attention operators running on the CPU and p95 latency exceeding the target. What is the first step?
Apply Question 4
With an effective weight read of 8GB per token and a measured effective bandwidth of 400GB/s, what is the simple memory ceiling for small-batch decode, and how should it be used?
Capstone Question 5
Which approval plan for moving from a CPU baseline to a new GPU, NPU, or Cloud TPU candidate is the most complete?
Requirements are Korean document consultation, four concurrent users, p95 TTFT of 1.5 seconds, 99% JSON format compliance and recovery to the existing backend on failure.
PERSONAL WORKSHEET
A learning worksheet you adapt to your own environment
Your input remains only on the current browser screen and is not stored or transmitted externally. Use categories and pseudonyms instead of actual sensitive information.
OFFICIAL SOURCES
Verify against official sources
Technical, compatibility, and model information reviewed: August 2026
Fix the task and exact GPU, OS, and runtime combination, and approve purchase or deployment candidates using memory, compatibility, quality, latency, and power evidence.
Difficulty
Practical
Structure
Lessons 5 · Labs 2 · Assessment
Diagrams and tables: composed by the author using each lesson's official primary sources. Find the originals and review dates at the end of that lesson.
NEW HIRE ONBOARDING
Start in the order you would receive your first assignment
So that even a new hire with no prior IT background can follow along, we start with the situation, the task, the evidence, and when to report, before difficult definitions.
01
Read the situation in one sentence
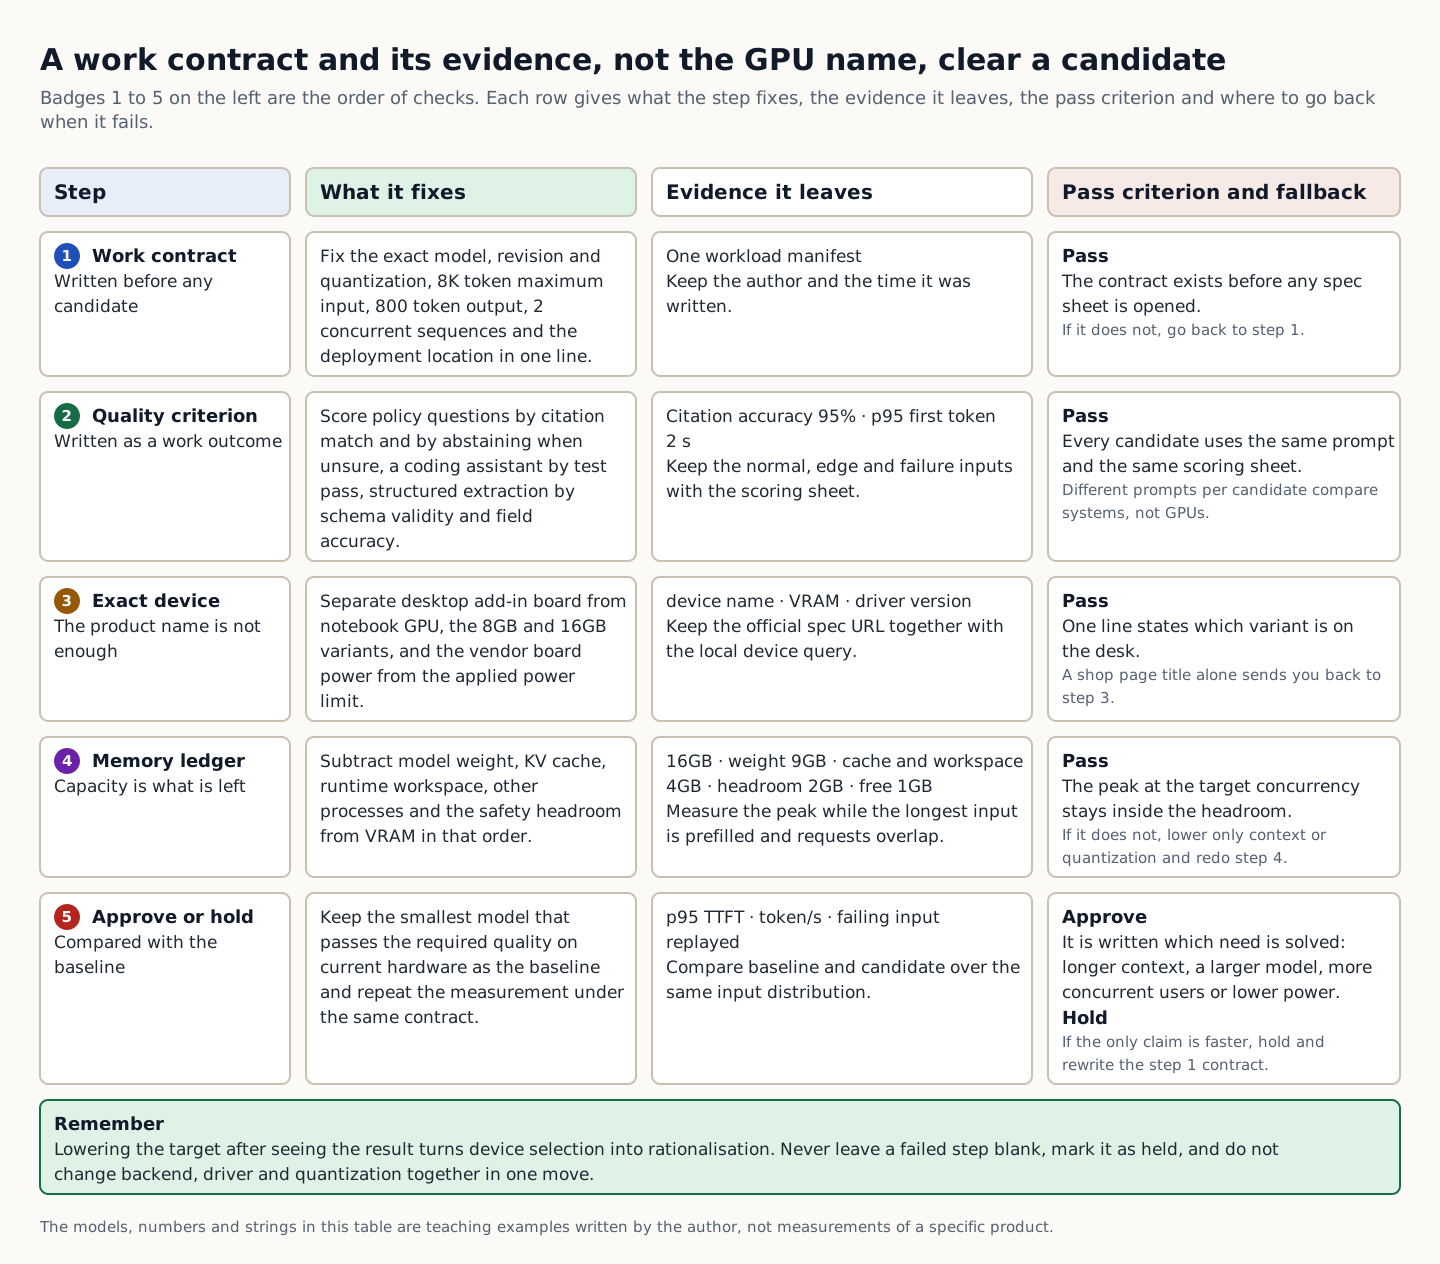
For Korean document consultation, write down 8K input, 800-token output, 2 concurrent users, a p95 first-token time of 2 seconds, and 95% citation accuracy before looking at candidates.
02
Today's assignment
Fix the task and exact GPU, OS, and runtime combination, and approve purchase or deployment candidates using memory, compatibility, quality, latency, and power evidence.
03
Evidence that shows the work is complete
Separate cold/warm states, prefill/decode, concurrency levels, and sustained load, repeating at least 3 times.
04
When to stop and ask a senior colleague
Keep the smallest passing model on your current hardware as the baseline.
Unpack unfamiliar terms first
VRAM
Memory used directly by a discrete GPU, where the product's total capacity must be distinguished from the amount the current process can safely use
Offload
An execution method that places some weights·operations in CPU RAM or on another GPU to extend capacity, but can introduce transfer·computation bottlenecks
TTFT
Time To First Token: the user-facing delay from sending a request until the first output token appears
PREREQUISITE CHECK
Three things to check before reading
This is not a test of memorized answers. Think about each question first, then open the explanation to review the foundational concepts used in this course.
1Is a GPU product's VRAM the same as the VRAM the current LLM process can safely use?
They are not the same. From the product's VRAM, you must account for the display·other processes, runtime workspace, and headroom for fluctuation. Measure the actual peak for the exact artifact at maximum context·concurrency load.
2Do a 16GB NVIDIA GPU and a 16GB AMD GPU automatically produce the same results with the same model·runtime?
No. Even with the same memory capacity, differences in GPU architecture, bandwidth and power, OS and driver, and operator and quantization support in CUDA, ROCm, and application backends can change actual placement, speed, and quality.
3Are peak TOPS·TFLOPS and LLM token/s the same metric?
They are not the same. Peak figures are theoretical upper limits under specific precision·operation conditions, whereas LLMs depend on memory movement, model graph·kernel, context·batch·concurrency, and runtime. Measure actual user-facing metrics on the same workload.
TEXTBOOK GUIDE
Main text that covers each concept from its background to the criteria for judging it
We explain the material section by section so readers new to IT can connect causes and effects without memorizing terms.
CONCEPT FLOW
How the chapters connect
The chapters are not isolated short answers to memorize. Follow them from left to right to see how each chapter's concepts support the next decision.
1.Write the workload contract before choosing a GPU→
2.Divide VRAM into weight, cache, and workspace ledgers→
3.Verify NVIDIA candidates through the entire CUDA dependency chain→
4.Verify AMD candidates against the ROCm matrix and the actual backend path→
5.Approving and rolling back purchases and deployments with the same workload
Model selection for AMD and NVIDIA GPUs: the overall map. If you lose track while reading the detailed explanations and chapters below, return to this sequence.
CONTROLLED EXPLANATION
Explore the order in which concepts build on each other
It does not start automatically. Play, or select the previous or next step, to see how the current concept connects to the next decision, step by step.
Current explanation · 1/5
Write the workload contract before choosing a GPU
GPU recommendations start from a work contract that fixes input length, concurrent users, quality, response latency, and operating location, not from a model name.
Define normal, boundary and failure inputs and output-scoring criteria before selecting hardware candidates.
Up next: Divide VRAM into weight, cache, and workspace ledgers, where this standard continues to apply.
See the full step description
1. Write the workload contract before choosing a GPU
GPU recommendations start from a work contract that fixes input length, concurrent users, quality, response latency, and operating location, not from a model name. Define normal, boundary and failure inputs and output-scoring criteria before selecting hardware candidates.
2. Divide VRAM into weight, cache, and workspace ledgers
Determine usable runtime capacity only after subtracting weight artifacts, KV cache, runtime workspace, other processes and safety margin from the device's VRAM. Do not add shared system memory to dedicated VRAM as if they formed one pool of equal speed.
3. Verify NVIDIA candidates through the entire CUDA dependency chain
An NVIDIA GPU being installed and the exact driver·CUDA runtime·framework·model operator being supported are separate gates. Compare official GPU specifications with the local device query, and pin driver and toolkit requirements to specific versions.
4. Verify AMD candidates against the ROCm matrix and the actual backend path
For AMD GPUs, set the candidate range by VRAM, then confirm the exact Radeon, OS, ROCm release, framework, and operator support as a single combination. Instead of the name "ROCm latest," record the exact row of the per-release Radeon, OS, and framework matrix.
5. Approving and rolling back purchases and deployments with the same workload
The final choice is not the highest peak specification but the candidate that passes essential quality, memory, p95 latency, sustained throughput, power and noise, and rollback under identical conditions. Separate cold/warm states, prefill/decode, concurrency levels, and sustained load, repeating at least 3 times.
The text description below shows the same content without the animation. Your operating system's reduced-motion setting is also respected.Conceptual explanation 01
Turn a recommendation question into an executable workload manifest
The question “Is a 16GB GPU enough?” cannot be answered without the model, context, and users. The workload manifest records the exact model ID·revision·artifact·quantization, tokenizer and chat template, normal and maximum input token counts, maximum output token count, number of concurrent sequences, and sampling settings. For interactive services, distinguish Time To First Token(TTFT), generation speed, and p95 End-to-End latency; for batch processing, prioritize completions per hour and failure rate. Without this contract, each candidate will be measured under conditions favorable to it.
Quality is not a condition outside hardware selection. For example, policy consultation measures answer correctness, citation agreement, and the rate of holding when uncertain; JSON extraction measures schema validity and per-field accuracy; coding measures test passes and security rules. If a Q4 model passes memory and latency but fails required accuracy, it cannot be approved as a fit for that GPU. Needing higher precision or a larger model means recalculating the memory ledger from the start, so quality and hardware form a single iterative process.
Distinguish mandatory gates from preferences. Citation accuracy at least 95%, p95 TTFT at most 2 seconds, peak VRAM at most 90%, and zero errors at target concurrency are conditions where any failure requires a hold. Average tokens/s, fan noise and expansion headroom may rank candidates that already pass. Adding everything into one arbitrary score can hide essential quality failures behind high peak performance, so judge pass/fail before comparing preferences.
Preserve the smallest model that passes essential quality on existing CPUs or GPUs as the baseline. State the new candidate’s required improvement in one sentence, such as 32K context, four concurrent users or higher precision. If problems occur after purchase, this baseline provides rollback for service continuity and cause isolation. Keeping existing hardware is also a valid conclusion if it already meets the goals.
Why does this happen?
GPU suitability is defined by the combination of the model, inputs, concurrency, quality and latency targets, rather than by the device alone.
When is it a problem?
Changing prompts, context, quantization and passing thresholds by candidate prevents explaining or reproducing hardware differences, even if results look good.
Common beginner misconceptions
It is wrong to assume that knowing only model parameters and VRAM determines the recommendation for every user, or that the largest model always delivers the highest task quality.
How to verify it yourself
With candidate names hidden, first record the exact artifacts, normal/boundary/failure inputs, concurrency, quality and p95 gates, and current baseline on one sheet.
Conceptual explanation 02
Identify the exact device, down to product name, VRAM variant, and laptop power
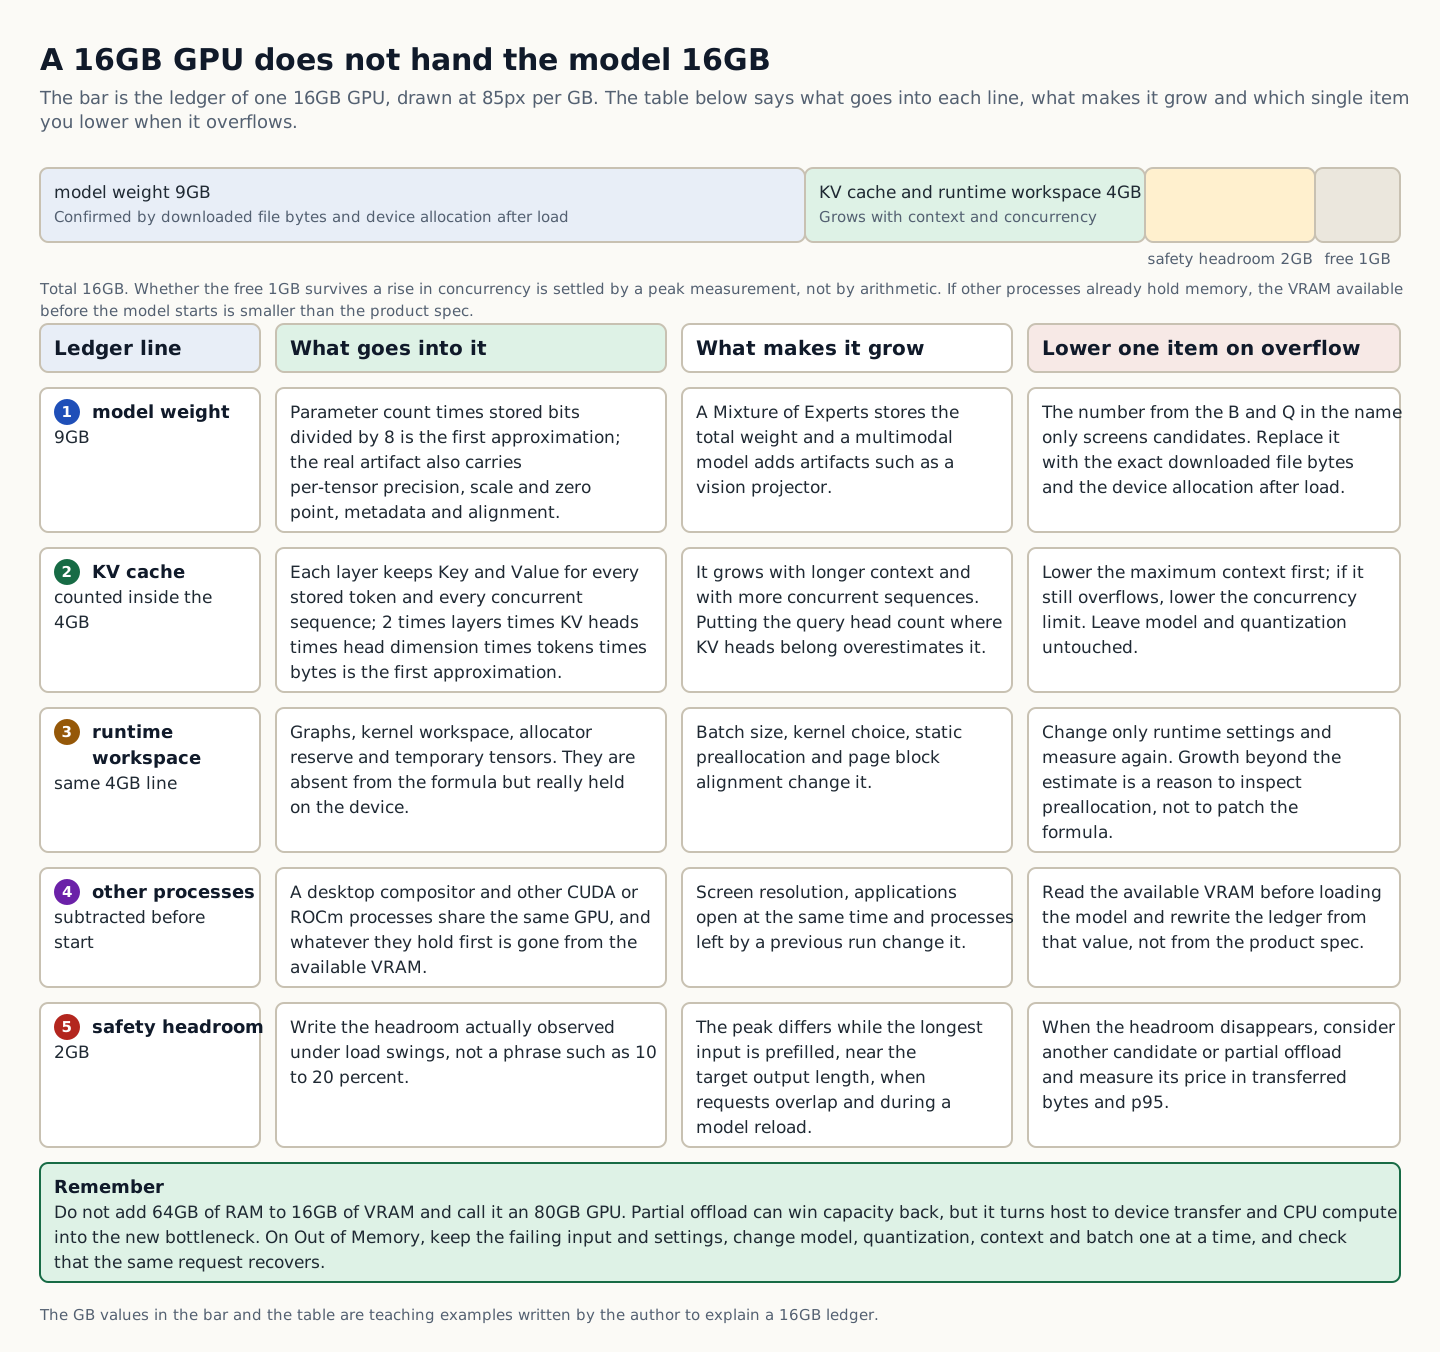
Record the GPU vendor, full model name, whether it is a desktop add-in board or notebook-integrated device, dedicated VRAM, board manufacturer and power limit. Names alone cannot establish the supported model range when memory variants share a name, as with RTX 4060 Ti, or multiple capacities have been sold, as with RTX 3080. Query the device through the operating system and check actual total VRAM. Separately record available VRAM at startup after accounting for other processes. Do not add shared GPU memory as though it were discrete VRAM.
Official NVIDIA and AMD product pages are primary sources for facts such as memory size and type, bandwidth, board power, and supported OSes. However, partner cards can differ in length, cooler, power connectors, and factory overclocking, and notebook manufacturers limit power. For example, even when a desktop and a notebook carry the same series number, you cannot expect the same sustained LLM throughput. Check the finished-product manufacturer's specifications and firmware power mode, then compare them with a local device query.
For used hardware, additionally check BIOS modifications, cooling condition, power connectors and actual memory errors. Normal booting and brief display output do not rule out errors under large VRAM allocations or long computations. Run memory tests and repeated inference before approving the purchase, and save temperature, clock and error logs. Appearance and the seller’s gaming benchmarks do not establish LLM workload stability.
Record official-URL review month, local device queries, driver version and OS build in the device manifest. Product pages and driver support change, so specify exact versions instead of 'latest'. Verification does not automatically carry over after hardware replacement or OS reinstallation despite unchanged names. Compare the new manifest with the old, then rerun from smoke tests onward.
Why does this happen?
Because even when only part of the model name matches, memory·power·cooling and driver paths can differ, changing the actual load and sustained throughput.
When is it a problem?
Buying on the strength of the VRAM in a listing title can mean that a different variant or notebook power limits keep the expected model from fitting, or that sustained performance is low.
Common beginner misconceptions
A higher generation number does not mean a newer GPU always runs larger models more reliably than an older product with more VRAM.
How to verify it yourself
Compare official specifications, board or notebook manufacturer documentation, and local device name, VRAM, and power limits in three rows. Resolve discrepancies before approval.
Conceptual explanation 03
Put weights, KV cache, workspace, and other processes in the same VRAM ledger
The theoretical weight size starts from the parameter count and storage bits, but an exact artifact also contains quantization scales, per-tensor mixed types, metadata, and alignment. Also check the total weights of Dense and Mixture of Experts models and additional artifacts such as a vision projector. A name like 8B Q4 does not mean every file is exactly 4GB or uses the same runtime allocation. Record the downloaded file's bytes, its checksum, and the device allocation after the model loads, in place of the starting formula.
KV cache grows with the number of layers, KV heads, head dimension, tokens, cache precision, and concurrent sequences. Runtime workspace, graph and kernel buffers, and allocator reserve are also needed. For example, even if 9GiB of weights loads on a 12GiB GPU, adding 2.2GiB of KV cache for a long input and 1.5GiB of workspace eliminates the safety margin. Measure the peak at the maximum allowed input and output and the target concurrency, not for an average conversation.
Desktop displays, browsers, and other compute processes also consume VRAM. Record free VRAM before startup and request peaks, and test model reloads and deployments starting multiple workers. Set headroom from observed variability and failure points under repeated load rather than mechanically applying 10% or 20% everywhere. Do not approve a candidate without headroom as stable merely because it succeeded once.
After Out of Memory, return to a successful baseline with a small context and a concurrency of 1. Do not change model, quant, context, batch, and offload simultaneously; lower one item and retest the same failing input. Keep the settings and logs from the moment of failure so you can explain the capacity boundary. The next lab judges weight·cache·workspace totals, a 90% safety line, official support, and rollback together rather than product VRAM.
Why does this happen?
LLM runtime memory includes, beyond static weights, cache and workspace that vary with request length and concurrency, so the peak can hit the product's capacity first.
When is it a problem?
Testing only file load will not reveal, before purchase, OOM failures or allocator fluctuations that first appear during maximum-context prefill or concurrent requests.
Common beginner misconceptions
Having more VRAM than the model file does not mean all remaining space is available for context, nor that a fixed headroom percentage is equally safe across runtimes.
How to verify it yourself
Measure weights, KV cache, workspace, other processes and peaks under normal and maximum context, concurrency 1 and the target value, and reload conditions. Record them in one ledger.
Conceptual explanation 04
Do not mistake GPU offload or multi-GPU for one large VRAM pool
Some runtimes place as many model layers as possible on GPU and compute the remainder in CPU RAM. This can enable larger models, but host-device tensor transfers and CPU computation can bottleneck decoding. Do not add 64GB system RAM and 16GB VRAM as one 80GB high-speed memory pool. Compare offloaded-layer count, host-RAM peak, transferred bytes, CPU utilization and p95 against a fully GPU-resident baseline.
Multiple GPUs are not merely summed VRAM. Tensor parallelism, pipeline splits and layer splits differ in weight/cache allocation, communication and operator support. Even when two 12GB cards fit the same model as one 24GB card, slow inter-GPU links or limited runtime splitting can change tokens per second and stability. Check motherboard slot bandwidth, peer access, power, cooling and backend multi-GPU support together.
The official llama.cpp multi-backend and operator documentation shows that CUDA, ROCm, Vulkan, and other backends have different feature coverage. Recognizing a device does not imply full support for a quantization, Flash Attention, KV-cache feature, or multi-GPU mode. Preserve startup logs for offloaded layers, per-backend tensor allocations, and CPU fallback. “99% GPU utilization” does not prove that every operator follows the intended path.
For recovery, return to a single GPU, a small model, and a short context, then add offload layers or a second GPU one item at a time. Compare output quality as well so that a wrong kernel or unstable peer path is not missed. Do not approve just because the OOM disappeared; require passing p95 at the target concurrency and repeated-error checks. Decide with the same workload whether multi-GPU beats a single large-VRAM candidate once cost, power, and complexity are included.
Why does this happen?
Because when memory is split across locations, data must be moved or synchronized between computations, so total capacity and actual throughput change independently.
When is it a problem?
Designing from the VRAM total alone may get the model to load, but CPU fallback, PCIe, and inter-GPU communication can push p95 and token/s far off target.
Common beginner misconceptions
It is wrong to think that adding the VRAM of two GPUs automatically works like a single GPU of that size in every runtime, or that system RAM offload is free.
How to verify it yourself
Run single-GPU, offload, and multi-GPU setups with the same manifest, and compare tensor placement, transfers and communication, host/device peaks, quality, and p95.
Conceptual explanation 05
Check NVIDIA through the GPU·driver·CUDA·framework·quant-kernel chain
The NVIDIA path links GPU architecture, installed driver, the application’s required CUDA runtime, framework wheel or container, and model features. A device appearing in `nvidia-smi` does not guarantee vLLM-container or quant-kernel support. NVIDIA CUDA compatibility documentation describes minimum drivers by major release and limits of minor-version compatibility. Record driver, toolkit or container CUDA, framework, and application versions separately in deployment records.
A new application may raise an initialization error on an old driver, or the PTX and driver support a new feature needs may be missing. Conversely, the backward compatibility that lets a new driver run older CUDA applications also has conditions. Do not recast the error as a model-size or VRAM problem; check the software chain first with a device query and a small official smoke test. Before a driver update, preserve the previous packages and image and the rollback procedure.
Quantization methods are not independent of GPU generation. vLLM’s quantization hardware-compatibility table shows that support varies by method and can change. Do not generalize support for a particular FP8·AWQ·GPTQ combination to another GPU or older vLLM version. Inspect exact-build startup logs and profilers for the selected quant kernel, attention features, and execution device, recording CPU fallback or disabled features.
Isolate problems in this order: device query, small matrix or runtime smoke test, a small, clearly supported model, loading the target artifact, short generation, and finally maximum context and concurrency. Do not update the driver, CUDA, framework, and model all at once. If the same failing input recovers on the previous image, upgrade one component at a time to find the first failure boundary. Base final approval on the exact version manifest and execution logs, not on a claim of “CUDA support.”
Why does this happen?
Because an application running on a GPU requires the user-space library, kernel driver, architecture-specific compiled code, and model features to all match.
When is it a problem?
Even when the device is visible, loading, speed, or quality can fail because of initialization errors, no kernel image, unsupported quants, or silent fallback.
Common beginner misconceptions
The CUDA number in `nvidia-smi` does not mean every installed toolkit·framework version and feature, and having an NVIDIA GPU does not mean every CUDA build will run.
How to verify it yourself
Record the exact driver, container, framework, application, and quant, check device, kernel, and feature logs on a small official model, and then expand to the target model.
Conceptual explanation 06
For AMD, confirm the Radeon, OS, ROCm release, framework, and backend as an exact row
AMD’s official product pages provide hardware facts such as exact Radeon memory size, type, bandwidth, and board power. The RX 9070 XT’s official 16GB specification establishes that product’s capacity, not a performance guarantee for every RX 9000 partner board or LLM runtime. Peak FP and INT figures are theoretical upper bounds under specific precision and matrix conditions. These figures alone cannot establish equal or different tokens/s compared with NVIDIA candidates with the same VRAM.
ROCm support depends on a combination of the operating system and kernel or Windows/WSL, driver, ROCm release, and framework version, not just a GPU name. The AMD compatibility matrix distinguishes the latest release from earlier releases and separates the Radeon, Ryzen, and Instinct paths. Save the row for the exact version you will deploy, and do not reuse success cases from another release. A community procedure that runs an unlisted GPU with an override demonstrates experimental feasibility, not official production support.
llama.cpp HIP/ROCm and Vulkan, PyTorch ROCm, and vLLM ROCm are separate application paths. Running a GGUF model on one path does not establish support in another framework. A Vulkan backend generating an answer, for example, does not use the same kernels and features as ROCm training libraries. Check exact build options, device discovery, offloaded layers, and operator tables, and choose a backend suited to the task.
Get device discovery and generation working on a small officially supported configuration, then raise the target quant, context, and concurrency one item at a time. Classify failures into install, driver, architecture and operator, memory, latency, and quality stages. If a workaround is needed, record in the approval sheet how likely it is to break on upgrade, who supports it, and how to restore the previous build. Choose the exact combination that passed the task gates, not a preference for AMD or NVIDIA.
Why does this happen?
Because ROCm and application support vary by release, platform, and framework, and each backend offers different operator and quant features.
When is it a problem?
Buying based only on GPU VRAM can leave the framework uninstallable on your chosen OS, or lose required performance and features through CPU fallback or unsupported quantization.
Common beginner misconceptions
Being a Radeon does not mean identical support across every ROCm release·Windows·Linux, nor can Vulkan·HIP·ROCm applications be treated as one identical backend.
How to verify it yourself
Connect the GPU, OS, driver, ROCm, and framework rows of the official matrix to the application build, device logs, and operator execution at exact versions.
Conceptual explanation 07
Measure cold·warm·prefill·decode and sustained load instead of peak specifications
Cold runs include process startup, model loading, compilation, and the first request; warm runs measure repeated requests with prepared caches. Prefill reads long inputs and decode generates tokens one at a time, so bottlenecks may differ. Separate TTFT, prefill token/s, decode token/s, and End-to-End latency, recording request throughput and errors at target concurrency. A brief token/s measurement alone cannot explain user waiting time.
Repeat each condition at least 3 times and record not only the mean but also p50·p95·maximum and run-to-run variation. For example, even if candidate A reaches a warm decode of 50 token/s, it can fail the interactive-service gate if cold compilation takes long and p95 TTFT is 5 seconds at a concurrency of 4. Candidate B may be a better fit if it decodes at 40 token/s but reliably passes the required quality and p95. Do not lower the targets after seeing the results to make a candidate pass.
Record peak device·host memory, GPU utilization, host-device transfers, CPU queues, power·temperature, and clocks on the same timeline in profiler and system metrics. A fast 30-second burst may lose throughput after 20 minutes of thermal throttling. Desktop fan noise·room power and notebook battery·power modes are actual usage conditions. Record different cooling or power limits as separate configurations rather than hiding them.
Also check that measurement tools do not distort the actual workload. Keep output token counts and stop conditions equal, and fix cache-hit status and concurrent arrival patterns. Numbers in the browser lab illustrate the decision procedure; they are not evidence from real hardware. Use logs and profilers from the exact runtime and anonymized task evaluations, and separate any changed driver, model, or prompt into a new run.
Why does this happen?
Input processing, generation, queuing, and sustained power and thermal conditions in LLM requests have different bottlenecks, so a single peak number does not represent the actual user experience.
When is it a problem?
Comparing only one warm decode run can leave cold start, long inputs, target concurrency, p95 latency, and sustained-load errors to surface for the first time after deployment.
Common beginner misconceptions
A candidate with higher TOPS, TFLOPS, or peak tokens/s is not necessarily faster and more stable at every context length, batch size, or user count.
How to verify it yourself
With a fixed manifest, run cold and warm conditions, prefill, decode, concurrency levels, and a 20-minute sustained load at least three times. Save quality, latency, memory, and power results together.
Conceptual explanation 08
Include power, chassis, cooling, price, and maintenance in the technical gate
For Desktop candidates, check GPU length/thickness, motherboard slot spacing, PSU capacity/quality and connectors, and case airflow. A powerful card fitting physically may still be unstable due to cable bends or blocked intake. CPU, system RAM, and model-loading storage speed affect cold start and offload too. Include required PSU, case, fan, and UPS replacements in the GPU-upgrade cost.
Power and noise are requirements for sustained operation, not merely preferences. For example, fan noise limits in a shared office or running on a notebook battery can make peak-power results unsuitable as defaults. Record wall power, device power, room temperature and fan profile as measurement conditions. Test lower-power candidates against the same quality and latency gates to find options that meet operating requirements with a small performance loss.
A price is not a fixed technical property of a product but a quote that depends on region, stock, taxes, used condition, and date. Do not put a particular price-performance ranking into course text as a permanent rule; instead, record two or three quotes at the time of purchase along with warranty·return·support terms in a separate table. Total cost includes power, extra parts, time spent on installation and driver problems, and replacement hardware in case of failure. Do not assume that the best VRAM/price ratio makes up for support gaps and long recovery times.
Maintenance responsibility is a selection criterion too. Personal experiments may tolerate community backends, while multi-user services prioritize supported releases, security updates, monitoring and rollback images. Assign ownership for reviewing the support matrix at next quarter's OS/runtime upgrade. Complete representative workload and recovery tests within the equipment return window; if mandatory gates fail, return to smaller-model, other-GPU or cloud candidates.
Why does this happen?
Because GPUs depend on power, space, heat, the host system, and software maintenance, and these costs and constraints determine how much time they are actually usable.
When is it a problem?
Buying only the card and then hitting PSU, space, or temperature problems, or spending operating time on unsupported updates, means gaining no benchmark benefit.
Common beginner misconceptions
Comparing GPU prices alone does not reveal total cost, and the most expensive or newest product is not necessarily best for your location and support staff.
How to verify it yourself
Record installation dimensions, power, cooling, noise, wall power, dated quotes, warranty, and update and rollback owners in the approval sheet.
Conceptual explanation 09
Make recommendations reproducible changes with approval records and rollback
Each row of the final comparison table represents an exact GPU, OS, driver, runtime and artifact combination. Columns cover official hardware and compatibility evidence; weights, cache, workspace and peaks; normal, boundary and failure quality; cold and warm performance, p95 and concurrency; sustained power, temperature and installation conditions. Link measurement dates, commands, configurations, logs and screenshots. Do not replace exact evidence with one row for an entire vendor or general claims such as “AMD is inexpensive” or “NVIDIA is compatible.”
Preserve failed results too. If a 16GB candidate hits OOM at 32K context and concurrency 2, record both the passing baseline at 8K/concurrency 1 and the first failure point. After recovery using a smaller model or different quantization, remeasure quality regressions. This supports both holding a purchase and setting operational admission limits. Do not fill blanks with averages; record verification owners and retest conditions.
Before approval, roll back to the previous CPU/GPU backend or driver/container and verify recovery of the same failing input. For hardware failures, define rerouting to a previous device or smaller model and limiting new requests. Document rollback artifacts, commands, expected recovery times and verification metrics so another operator can execute them. Browser exercises consisting only of checkbox selections demonstrate procedural understanding, not actual recovery.
A recommendation’s validity is tied to its date and manifest. When drivers, ROCm, CUDA, runtime, model revision, context, concurrency, or task-quality criteria change, rerun the official matrix and the regression set. The conclusion should not be “NVIDIA beats AMD” but “this exact candidate passed every essential gate for this workload and must be revalidated outside these conditions.” Only then can others reproduce the judgment when buying or updating the same hardware.
Why does this happen?
Because hardware support, software support, and workloads keep changing, a recommendation for the same name cannot be reused without the selection rationale and a recovery path.
When is it a problem?
Keeping only passing values prevents identifying regression causes after updates and returning to the previous stable configuration during incidents, prolonging outages.
Common beginner misconceptions
A GPU recommendation that passed once does not apply permanently to every model, runtime, and OS, and a brand ranking table cannot replace exact verification.
How to verify it yourself
Independently review whether another person can reproduce the same results and rollback using only the manifest, artifacts, commands, and failing inputs.
CONCRETE CASES
Check concepts in different situations
Before memorizing definitions, compare how these concepts appear on a personal PC and in real work.
Case 1 · Write the workload contract before choosing a GPU
For Korean document consultation, write down 8K input, 800-token output, 2 concurrent users, a p95 first-token time of 2 seconds, and 95% citation accuracy before looking at candidates.
Key points to check here: Define normal, boundary and failure inputs and output-scoring criteria before selecting hardware candidates.
Case 2 · Divide VRAM into weight, cache, and workspace ledgers
On a 16GB GPU, 9GB of weights, 4GB of cache·workspace, and 2GB of safety headroom leave 1GB. Measure peak usage to check whether that remaining 1GB can accommodate increased concurrent requests.
Key points to check here: Do not add shared system memory to dedicated VRAM as if they formed one pool of equal speed.
Case 3 · Verify NVIDIA candidates through the entire CUDA dependency chain
If a new GPU is visible to the operating system but a new CUDA build on an old driver raises an initialization error, shrinking the model does not fix the compatibility problem.
Key points to check here: Compare official GPU specifications with the local device query, and pin driver and toolkit requirements to specific versions.
Case 4 · Verify AMD candidates against the ROCm matrix and the actual backend path
Even with the RX 9070 XT’s official 16GB specification verified, hold the deployment candidate if the selected Windows or Linux release and vLLM·PyTorch·llama.cpp path are unsupported.
Key points to check here: Instead of the name "ROCm latest," record the exact row of the per-release Radeon, OS, and framework matrix.
Case 5 · Approving and rolling back purchases and deployments with the same workload
If candidate A decodes quickly but fails p95 first-token and fan-noise requirements, while B passes every essential gate, B may be approved despite lower peak tokens/s.
Key points to check here: Separate cold/warm states, prefill/decode, concurrency levels, and sustained load, repeating at least 3 times.
CHAPTER 1 / 5
Write the workload contract before choosing a GPU
Questions such as “Which LLMs can an RTX 5090 run?” or “Is a 16GB Radeon the same as a 16GB NVIDIA card?” leave out essential conditions. Even on the same GPU, a single 2K conversation and two 32K documents differ in Key·Value cache and queueing, and interactive generation and batch document processing weigh first-token latency and throughput differently. Comparison can begin only after you pin down the exact model·revision·quantization, maximum input·output tokens, concurrent sequences, required features, and quality criteria in a one-line workload manifest.
Define quality through task outcomes, not whether answers look good. For internal policy questions, measure correctness, citation agreement and holding when uncertain; for coding assistants, test success and prohibited-API use; for structured extraction, schema validity and field accuracy. If essential quality is low despite fast hardware, consider a larger model or different quantization and recalculate memory and latency requirements. Giving candidates different prompts or easier questions compares different systems rather than GPUs.
Record hardware names exactly as well. Distinguish desktop add-in boards from notebook GPUs, memory capacity variants, and manufacturer board power from the actual power limit, and confirm the device name, VRAM, and driver in the operating system. The same product family name can have 8GB and 16GB variants, and notebooks have different power and cooling limits. Do not record only sales page titles or search results; keep the official specification URL and local device query results together.
Build the first baseline with the smallest model that passes the essential quality bar on the CPU or GPU you already have. Then you can explain the value of a new GPU not simply as “faster” but by which requirement it solves: longer context, higher precision, a larger model, more concurrent users, or lower power. Without a clear purchase goal, even top specifications leave actual work unchanged, and there is no verified baseline to return to when problems arise.
How to read the figure A candidate passes on the strength of the work contract and the evidence from each step, not the GPU name. Record any step that fails as on hold, and do not change the backend, driver, and quantization all at once.
To recap the key points
Define normal, boundary and failure inputs and output-scoring criteria before selecting hardware candidates.
Keep the smallest passing model on your current hardware as the baseline.
How this connects in practice
For Korean document consultation, write down 8K input, 800-token output, 2 concurrent users, a p95 first-token time of 2 seconds, and 95% citation accuracy before looking at candidates.
CHAPTER 2 / 5
Divide VRAM into weight, cache, and workspace ledgers
A first approximation of weight size is parameter count×storage bits÷8, but the actual artifact includes per-tensor precision, scale·zero point, metadata, and alignment. Dense and Mixture of Experts models must store their total weights, and multimodal models may include additional artifacts such as a vision projector. So a number obtained by multiplying only the B and Q in the name is a starting value for screening candidates and must be replaced with the exact downloaded file bytes and the device allocation after loading.
During generation, per-layer Key and Value caches grow with context tokens and concurrent sequences. The runtime also uses graphs, kernel workspace, allocator reserves, and temporary tensors. If a desktop compositor or other CUDA or ROCm processes share the GPU, the VRAM available before the model starts is smaller than the product specification. In the safety ledger, record model weights, cache, workspace, other processes, and the headroom confirmed under actual load variation separately, not an arbitrary figure such as 10–20%.
System RAM and discrete GPU VRAM differ in address space and data path. Some runtimes support offload that keeps layers or tensors in CPU RAM, but token/s and p95 change when data must cross PCIe on every request or the CPU performs the computation. Do not count "64GB RAM + 16GB VRAM" as equal to one 80GB GPU. Check the number of offloaded layers, host memory peak, transferred bytes, and link utilization in the profiler, and compare with a fully GPU-based baseline using the same prompt.
Memory failure is not settled by whether the load succeeds. Peak usage can shift at the moment the longest input is prefilled, as output approaches the target length, when concurrent requests overlap, and during model reload. Start from a success baseline with a small context and concurrency 1, increase one variable at a time, and after an Out of Memory error do not change model·quant·context·batch at once. Hardware limits become reproducible only when you preserve the failed input and settings, lower a single item, and confirm whether the same request recovers.
How to read the figure Total VRAM is not handed to the model as is. List the five items separately and verify that actual peaks under representative and edge-case loads stay within the safety headroom.
To recap the key points
Do not add shared system memory to dedicated VRAM as if they formed one pool of equal speed.
Partial offload can recover capacity but introduces host-device transfers and CPU computation as new bottlenecks.
How this connects in practice
On a 16GB GPU, 9GB of weights, 4GB of cache·workspace, and 2GB of safety headroom leave 1GB. Measure peak usage to check whether that remaining 1GB can accommodate increased concurrent requests.
CHAPTER 3 / 5
Verify NVIDIA candidates through the entire CUDA dependency chain
NVIDIA’s official product specifications are primary sources for memory capacity·type, board power, and generation-specific capabilities. Actual add-in-card length·power connectors·coolers and notebook power limits may have separate specifications. Before purchase, check chassis space, power-supply capacity and connectors, cooling, and sustained temperatures. Fast 30-second generation may still fail everyday needs if clocks drop or noise exceeds limits during a 20-minute load.
A CUDA application needs not only a CUDA-capable GPU but also an NVIDIA driver compatible with its build. NVIDIA's CUDA compatibility documentation describes minimum drivers for major releases and feature restrictions under minor-version compatibility. The CUDA indication at the top of `nvidia-smi` does not identify the entire installed toolkit, so record the driver, CUDA runtime bundled with the application, and framework wheel or container tag separately. Do not misdiagnose initialization errors or missing kernels as model-quality problems.
Framework support for NVIDIA does not mean every GPU and precision/quantization combination works the same. vLLM's quantization documentation states that the per-method supported hardware tables can change. Check that the AWQ, GPTQ, bitsandbytes, FP8, or other method selected in the exact vLLM version fits the GPU architecture, and look for fallbacks or disabled unsupported features in the startup log. A compute capability number alone is not final evidence; the model architecture and kernel combination must actually be run.
Start recovery with a known small model, an official container, and a single GPU. Expand in order through device query, small matrix or runtime smoke test, model load, short generation, and target context and concurrency. Upgrading the driver, CUDA, framework, and model at the same time hides which boundary broke. Confirm that the previous image and driver combination recovers the same failing input, change one layer at a time, and keep both success and failure logs and versions in the approval manifest.
To recap the key points
Compare official GPU specifications with the local device query, and pin driver and toolkit requirements to specific versions.
Use logs and the profiler to confirm that compute capability, quant kernels, and attention features are actually enabled in the build.
How this connects in practice
If a new GPU is visible to the operating system but a new CUDA build on an old driver raises an initialization error, shrinking the model does not fix the compatibility problem.
CHAPTER 4 / 5
Verify AMD candidates against the ROCm matrix and the actual backend path
AMD’s official product pages specify memory size, type, bandwidth, board power, and OS support for an exact Radeon product. RX 9070 XT figures establish that product’s specifications, not the performance of every RX 9000 product, partner board, or LLM runtime. Peak FP and INT figures are upper bounds under specified precision and matrix conditions. Specifications alone cannot establish equal or different tokens/s compared with NVIDIA products of the same memory capacity.
ROCm support is not a property of the GPU alone; it is a combination of GPU, operating system and kernel or Windows/WSL, driver, ROCm, and framework versions. AMD's official compatibility matrix divides support rows by release and platform. Do not mix tables from other releases or documents for Instinct and Radeon; save the row for the exact version you will deploy. Reports of running an unlisted GPU with an environment variable override may be useful experimental information, but do not label them as official production support.
llama.cpp offers backends including CUDA, HIP/ROCm, and Vulkan, but the official operator table distinguishes full, partial, and unsupported functionality per backend. One successful model response does not mean every layer and quantized kernel ran on the GPU. Check logs for build options, backend devices, offloaded-layer counts, CPU fallback, and features such as Flash Attention and KV quantization. Do not record Vulkan success as ROCm-framework support.
Build a small passing baseline for the AMD path using an exact build. Start with an officially supported OS and driver, one GPU, and a small model and quantization with clear support, then increase the target artifact and context one at a time. Classify failures by installation, device discovery, operator, memory, or quality stage. Verify recovery of the same prompt on the previous build. If using a community workaround, separately approve support gaps, upgrade risks, and rollback procedures.
To recap the key points
Instead of the name "ROCm latest," record the exact row of the per-release Radeon, OS, and framework matrix.
Even when backend names such as HIP, Vulkan, or llama.cpp match, do not assume the same operator, quantization, and multi-GPU features or the same speed.
How this connects in practice
Even with the RX 9070 XT’s official 16GB specification verified, hold the deployment candidate if the selected Windows or Linux release and vLLM·PyTorch·llama.cpp path are unsupported.
CHAPTER 5 / 5
Approving and rolling back purchases and deployments with the same workload
Pin the model, revision, artifact hash, tokenizer, template, quant, runtime, build, driver, prompt and output tokens, sampling, context, and concurrency in the comparison manifest. Include boundary and failure inputs such as maximum-length documents, empty retrieval results, malformed formats, and safety refusals, not just normal inputs. If each candidate must be allowed its own best settings, disclose the differences and their quality impact, and run a common baseline so causes can be interpreted.
Separate metrics by stage. Measure cold start, model loading and compilation, warm Time To First Token (TTFT), prefill tokens/s, decode tokens/s, end-to-end latency, request throughput by concurrent-user level and failure rate. Save p50, p95, maximums and run-to-run variation instead of one average. Jointly examining peak VRAM, host RAM, GPU utilization, transfers, power, temperature and clocks helps distinguish memory, CPU queues, thermal throttling and kernel bottlenecks.
Purchase decisions include power supplies, chassis and cooling changes, electricity, installation, driver maintenance, and downtime as well as equipment price. An arbitrary aggregate score can hide mandatory failures in averages. Separate must-pass gates, such as “quality at least 95%, p95 TTFT at most 2 seconds, peak VRAM at most 90%, and zero errors under a 20-minute sustained load,” from preferred metrics. Record dated quotes for each region and time.
Before approval, roll back to the previous CPU/GPU backend and retest the same failing workload. Driver/runtime problems should allow image rollback without replacing hardware; hardware failures need a runbook limiting requests to previous devices or smaller models. Record that an exact combination passed a specific workload contract with dated evidence, rather than a brand ranking. Reevaluate when versions or tasks change.
To recap the key points
Separate cold/warm states, prefill/decode, concurrency levels, and sustained load, repeating at least 3 times.
Do not approve a failing candidate by lowering targets after seeing results. Record hold reasons and alternatives.
How this connects in practice
If candidate A decodes quickly but fails p95 first-token and fan-noise requirements, while B passes every essential gate, B may be approved despite lower peak tokens/s.
INTERACTIVE LAB 1 / 2
Lab 1 · GPU capacity and compatibility approval lab
Enter values in the browser and check the execution results and the failure and recovery paths. No commands are ever sent to real equipment or the NAS.
Approve memory and software fit for the exact GPU
Instead of choosing only a GPU product name, judge weights, cache, workspace, and evidence of exact support, execution, and rollback in a single gate. The defaults are designed to fail.
Situation
It was approved because the 5.2GiB artifact fits on an RTX 4060 Ti 8GB, but it runs out of memory (OOM) at the maximum context and some layers run on the CPU.
Goal
Check the exact device's safe VRAM limit, the officially supported GPU, OS, driver, runtime and quantization combination, and the actual execution path together.
Prerequisites
Prepare official product specifications, local device and VRAM queries, the exact artifact, cache and workspace peaks under the target load, the compatibility matrix, and profiler logs.
Success criteria
The runtime budget is at or below 90% of VRAM, and exact support, GPU placement, zero fallback and recovery to the previous backend are all verified.
Select the actual device and VRAM variant, and enter measured values for the artifact, cache, and workspace.
Reflect the exact row of the official matrix, startup logs, profiler output, and rollback evidence.
Run the GPU suitability gate Then recover the same failing input by changing one item at a time from a small passing baseline.
Evidence limits: The GPU list and model ranges are a conservative starting point for narrowing candidates. This browser does not run the actual device, driver, artifact, or profiler, so it does not replace the official matrix, local peak measurements, or quality results.
INTERACTIVE LAB 2 / 2
Lab 2 · Same-workload purchase approval lab
Enter values in the browser and check the execution results and the failure and recovery paths. No commands are ever sent to real equipment or the NAS.
Approving a purchase based on quality·p95·sustained performance on the same workload
Judge predefined quality, user latency, memory, sustained stability, and rollback together rather than peak TOPS or one token/s result. Defaults intentionally fail.
Situation
The new 16GB GPU was fast on short warm generations, but Korean accuracy fell below the criterion, p95 TTFT exceeded the target, and clock speed dropped after 20 minutes.
Goal
Compare baseline and candidate under the same manifest and pass all mandatory quality, latency, memory, and sustained-load gates.
Prerequisites
Prepare exact artifact/runtime/driver identities, normal/boundary/failure evaluations, at least 3 cold/warm and concurrency runs, profiler/power/temperature evidence, and rollback logs.
Success criteria
Quality, p95, decode, 90% memory, and 20-minute sustained throughput meet targets, with evidence of an identical contract, thermal behavior, and rollback.
Before seeing results, fix the required quality, p95 TTFT, and decode targets and the candidate VRAM.
Enter measurements for the same workload, peak VRAM and the throughput retention rate after 20 minutes.
Run purchase benchmark gates Then change only the candidate or one execution condition and retest without lowering targets.
Evidence limits: Inputs and checkboxes are self-reports for practicing measurement procedures. Actual purchase approval requires commands, logs, original evaluations, power/temperature time series and tested rollback artifacts.
KEY TERMS
Key terms in this unit
VRAM
Memory used directly by a discrete GPU, where the product's total capacity must be distinguished from the amount the current process can safely use
Offload
An execution method that places some weights·operations in CPU RAM or on another GPU to extend capacity, but can introduce transfer·computation bottlenecks
TTFT
Time To First Token: the user-facing delay from sending a request until the first output token appears
Compatibility matrix
Table of officially supported GPU, OS, driver, runtime, framework, and feature combinations by version
UNIT WORKBOOK
Exercises and worksheets for applying concepts to new situations
Start by checking basic principles, then expand to practical workplace decisions. After submitting an answer, you can see why every option is correct or incorrect, not just the correct answer.
Basic Question 1
What is the safest way to record, in an LLM hardware table, a GPU whose online listing title says only "RTX 4060 Ti"?
Basic Question 2
On an 8GiB GPU using 5.2GiB for weights, 1.8GiB for KV cache at the target load, and 1.0GiB for runtime workspace, what is the verdict against the 90% safety line?
Apply Question 3
An NVIDIA GPU appears in nvidia-smi, but a new vLLM container fails with an initialization error. What is the most appropriate first diagnostic step?
Apply Question 4
On a 16GB Radeon candidate, GGUF produced one answer using Vulkan. Can this be recorded as evidence of production ROCm·vLLM support?
Capstone Question 5
Which is the most complete plan for approving the purchase of NVIDIA or AMD GPU candidates for Korean document consultation?
Requirements are the exact model and quantization, 16K input, two concurrent users, 95% citation accuracy, p95 TTFT of 2 seconds and peak VRAM usage at or below 90%. On failure, the system must return to the existing CPU backend.
PERSONAL WORKSHEET
A learning worksheet you adapt to your own environment
Your input remains only on the current browser screen and is not stored or transmitted externally. Use categories and pseudonyms instead of actual sensitive information.
OFFICIAL SOURCES
Verify against official sources
Technical, compatibility, and model information reviewed: August 2026
Choose a personal AI system based on unified memory capacity, bandwidth, CPU architecture, the software ecosystem, and evidence from real inference, LoRA, and service workloads.
Difficulty
Practical
Structure
Lessons 5 · Labs 2 · Assessment
Diagrams and tables: composed by the author using each lesson's official primary sources. Find the originals and review dates at the end of that lesson.
NEW HIRE ONBOARDING
Start in the order you would receive your first assignment
So that even a new hire with no prior IT background can follow along, we start with the situation, the task, the evidence, and when to report, before difficult definitions.
01
Read the situation in one sentence
A personal 70B Q4 chat and a 14B model API serving eight concurrent users may need similar memory, but their throughput and operational requirements are completely different.
02
Today's assignment
Choose a personal AI system based on unified memory capacity, bandwidth, CPU architecture, the software ecosystem, and evidence from real inference, LoRA, and service workloads.
03
Evidence that shows the work is complete
Spell out the claim “training is possible” as full training and the precision, batch, and checkpoint conditions for LoRA and QLoRA.
04
When to stop and ask a senior colleague
Record whether stopping is acceptable when one machine fails, and the recovery paths to cloud or existing hardware.
Unpack unfamiliar terms first
Unified memory
A structure where CPU and GPU access one physical memory pool, requiring per-runtime verification of actual allocation, synchronization, and contention among the OS and applications
Memory bandwidth
The amount of data that can be read from and written to memory per second; a metric that distinguishes the official peak from the effective value for the workload
ARM64
A host condition for the 64-bit Arm instruction set architecture used in systems such as DGX Spark, which requires separately checking compatibility with x86_64-only binaries and containers
PREREQUISITE CHECK
Three things to check before reading
This is not a test of memorized answers. Think about each question first, then open the explanation to review the foundational concepts used in this course.
1Is the total capacity of unified memory the same as dedicated VRAM used exclusively by the GPU?
No. The CPU and GPU access the same physical pool, which the operating system, display, applications, weights, cache, and workspace all share. Measure the actual peak and available memory at each stage.
2If the model loads into memory, are chat speed and LoRA·multi-user service automatically sufficient?
No. Loading is only one capacity gate. Decode bandwidth, prefill and training compute, activations and optimizer state, queues and p95, long-duration power and thermals, and operational recovery must each be tested for their purpose.
3Why do ARM64 and x86_64 matter when choosing an AI system?
Differences in CPU instruction sets mean a container image, wheel, or native extension may support only one architecture. Run the full RAG, database, OCR, and monitoring dependency stack on the exact host, not only the GPU runtime.
TEXTBOOK GUIDE
Main text that covers each concept from its background to the criteria for judging it
We explain the material section by section so readers new to IT can connect causes and effects without memorizing terms.
CONCEPT FLOW
How the chapters connect
The chapters are not isolated short answers to memorize. Follow them from left to right to see how each chapter's concepts support the next decision.
1.Define the role of a personal AI system before choosing products→
2.Distinguish unified-memory capacity from bandwidth and contention→
3.Interpret DGX Spark ARM64 and CUDA conditions and maximum-model claims→
4.Compare Ryzen AI Max+ and Apple Silicon by memory and runtime path→
5.Approve inference, LoRA, and multi-user operation separately
DGX Spark and AI workstations: the overall map. If you lose track while reading the detailed explanations and chapters below, return to this sequence.
CONTROLLED EXPLANATION
Explore the order in which concepts build on each other
It does not start automatically. Play, or select the previous or next step, to see how the current concept connects to the next decision, step by step.
Current explanation · 1/5
Define the role of a personal AI system before choosing products
Personal experiments loading large models, adapter training and multi-user 24-hour APIs require different memory, latency and availability contracts.
Define the exact model, precision, context, concurrency and required quality before choosing equipment candidates.
Up next: Distinguish unified-memory capacity from bandwidth and contention, where this standard continues to apply.
See the full step description
1. Define the role of a personal AI system before choosing products
Personal experiments loading large models, adapter training and multi-user 24-hour APIs require different memory, latency and availability contracts. Define the exact model, precision, context, concurrency and required quality before choosing equipment candidates.
2. Distinguish unified-memory capacity from bandwidth and contention
When the CPU and GPU share an address space, placing an artifact larger than a separate VRAM pool becomes easier, but the OS, CPU, and GPU share the same capacity and bandwidth, so weights cannot fill all of memory. Subtract OS, display, application, cache, workspace and safety headroom separately from total product memory.
3. Interpret DGX Spark ARM64 and CUDA conditions and maximum-model claims
DGX Spark provides 128GB LPDDR5x unified memory and NVIDIA's software stack, but verify the ARM64 host, official 273GB/s bandwidth, software versions, and model conditions together. Record official maximum model figures as a conditional capability tied to exact precision, software, and workload.
4. Compare Ryzen AI Max+ and Apple Silicon by memory and runtime path
Both the Ryzen AI Max+ family and Mac Studio offer large unified-memory configurations, but they differ in their x86 and ROCm/other-backend versus Apple MLX and Metal ecosystems, and in product-specific bandwidth and memory configurations. Distinguish the processor's maximum memory from the actual finished product's configuration and firmware GPU allocation.
5. Approve inference, LoRA, and multi-user operation separately
Loading large models, training adapters and operating a 24-hour service require different memory, storage, network, observability and availability, so each needs separate workload and rollback tests. Spell out the claim “training is possible” as full training and the precision, batch, and checkpoint conditions for LoRA and QLoRA.
The text description below shows the same content without the animation. Your operating system's reduced-motion setting is also respected.Conceptual explanation 01
Define the task and failure domain before choosing an AI box product line
Personal AI systems include compact CPU/GPU boxes, Apple Silicon workstations, and development systems bundled with NVIDIA software stacks. They may all handle large models on a desk, but differ in CPU architecture, memory bandwidth, accelerators, and OS·runtime. Size or the label “AI computer” does not prove your artifact loads and required operators execute. Compare exact configurations and workloads in individual rows.
Separate tasks into single-user interactive inference, document batches, LoRA/QLoRA and multi-user APIs. A 70B Q4 single-user conversation emphasizes weight capacity, while a 14B service for eight concurrent users may depend more on KV cache, queues and p95. LoRA requires activations, gradients, optimizer state and checkpoints, using more memory and storage than inference on the same base. Do not approve all purposes using one maximum-model number.
Define Data boundaries and availability first. A local system may keep source material inside, yet accounts, telemetry, remote management, model downloads, and logs can still connect externally. Putting the service and artifacts on one box and internal SSD lets hardware failure cause complete outage and data loss. Include allowed downtime, backup location, spare/cloud/existing-equipment fallback, and measured recovery time in the business contract.
Preserve current hardware’s quality and latency baseline and state the limits the new box must resolve. Buying large memory without a goal may allow model loading while speed, software and operations still fall short. With candidate identities hidden, run identical artifacts, inputs, outputs, concurrency and evaluation rubrics. Hold systems failing essential gates regardless of advertised maximums.
Why does this happen?
This is because the same memory capacity faces different cache·activation·queue and recovery responsibilities depending on whether it serves inference, training, or a service.
When is it a problem?
Mixing purposes can lead you to mistake a successful large-model load for passing LoRA, concurrent-user, or 24-hour availability requirements.
Common beginner misconceptions
Products labeled AI boxes do not necessarily offer similar runtimes, speeds, or availability, and one box may not suffice for everything from development to production.
How to verify it yourself
Before naming candidates, specify the exact model, precision, context and concurrency, required quality, p95 latency and job duration, and acceptable failures and fallback behavior.
Conceptual explanation 02
Subtract OS, application, cache, and workspace usage from total unified memory
Unified memory lets CPUs and GPUs access one physical pool, making it easier to place larger weights than in discrete VRAM. However, the OS, desktop display, filesystem cache, tokenizer, and database share that total. For example, in a 128GB system, reserving 10GB for OS and applications, 82GB for weights, 22GB for KV cache and workspace, and 12GB of headroom leaves only 2GB for additional concurrency. Do not equate total product memory with artifact bytes.
Estimate weights from the model name, then replace the estimate with exact file bytes and load allocation. Quant scales·metadata, mixed tensors, vision projectors, and MoE total weights can be missed in a name-based calculation. KV cache grows with context and concurrent sequences, and training adds activations·gradients·optimizer state. Measure system-wide and accelerator allocation peaks separately for load, maximum prefill, long decode, target concurrency, and training steps.
Check the meaning of memory-reporting tools for each system. A unified architecture may show CPU and GPU usage with overlap or from different perspectives, and display-reserved memory·firmware settings may change availability. Collect process-resident memory, system-available memory, GPU allocation, and swap·memory pressure over time rather than saving one number. If a tool reports “VRAM 0” or unsupported, use the reporting path recommended in official documentation.
Recover from failure by returning to the smallest model, context and batch, then expanding one item at a time. Continuing without OOM through swap is not sufficient for success: storage I/O can sharply increase p95 latency or training-step duration. If quantization precision was reduced, reevaluate quality regressions; if context was reduced, reevaluate task completeness. Verify recovery from the same failure using the previous artifact and settings.
Why does this happen?
Because one physical pool is shared by multiple system components and allocation differs at each workload stage, the product’s total capacity does not equal a process’s safe budget.
When is it a problem?
Checking only weight loading can let memory pressure, swap, and OOM surface for the first time at maximum context, concurrency, or training steps.
Common beginner misconceptions
Unified memory does not give the GPU exclusive use of total memory or eliminate capacity limits, data movement, and synchronization costs.
How to verify it yourself
Record OS, application, weight, cache, workspace and swap peaks during startup, loading, prefill, decoding, target concurrency or training steps in one ledger.
Conceptual explanation 03
Separate capacity from bandwidth, compute, and power ceilings
Small-batch decoding repeatedly reads weights and is often memory-bandwidth limited. With effective reads of 80GB per token and effective bandwidth of 240GB/s, the simplified memory ceiling is approximately 3 tokens/s. Cache reuse and quantization kernels change assumptions, so use this as a sanity check for measurement and unit inconsistencies, not an exact prediction. Use profiler-derived effective bandwidth rather than official peak bandwidth.
Long-prompt prefill and training have different mixes of matrix computation and activation and memory traffic. Do not translate product FP4 sparsity TOPS into BF16 LoRA throughput or universal LLM tokens/s. Use a profiler to verify that exact operators and precisions use hardware units and are supported by runtime kernels. If a candidate supports only a different quantization, disclose quality and artifact differences and retain a common high-precision baseline.
Power and thermals also change ceilings. Compact systems may reach high clocks during short bursts but hit temperature or power limits during long generation·training. Record wall power, SoC or package power, clock·temperature, and token/s·step/s on the same timeline. Do not report a 30-second demo and a 30-minute job as equivalent sustained performance; also record office noise·room temperature.
In the second lab, official bandwidth and TOPS are not ranked directly; they are judged together with task quality, p95 and job time, memory peak, and 30-minute retention. If the results fail, do not lower the targets afterward; change only one of the model, runtime, power mode, or system candidate. A slower candidate that reliably passes every mandatory gate may actually be the better fit.
Why does this happen?
Capacity, data supply rate, compute rate, and long-duration power state are distinct physical constraints, and which limit is reached first differs at each workload stage.
When is it a problem?
Looking only at maximum model loading or peak TOPS can leave conversational tokens/s, long prefill, training-step and sustained-load failures undiscovered until after purchase.
Common beginner misconceptions
More memory does not necessarily mean faster execution, and a system with higher advertised bandwidth·TOPS does not always lead at every precision·runtime.
How to verify it yourself
Using the same manifest, separately measure effective bandwidth, latency·throughput, and power·temperature during load·prefill·decode·training and a 30-minute load.
Conceptual explanation 04
Read the official DGX Spark specifications and the 200B statement as conditional capabilities
NVIDIA's official hardware documentation states that DGX Spark uses the Grace Blackwell architecture, a 20-core Arm processor, 128GB LPDDR5x unified system memory, and 273GB/s bandwidth. The 240W supplied power adapter, 140W GB10 TDP, storage, and 10GbE·ConnectX-7 are also system conditions. Do not present these specifications as the same memory path as GDDR VRAM on a desktop RTX or HBM on a datacenter GPU.
Explain the artifact, precision, context, and software conditions behind official support for models up to 200B or larger models on dual systems. A 200B parameter count does not mean a 200GB file or a fixed tokens/s rate. For MoE, total weights rather than activated parameters may determine loading requirements. Reproduce the exact image and model from the official example, inspect file bytes, memory peaks, and tokens/s, then substitute your task model and evaluation set.
One machine and two machines are different systems. Dual configurations add network links, model splitting, runtime support and communication. Do not treat combined memory as one pool; verify placement, link bytes and latency, partial-system behavior on failure and recovery. Even when a large model loads across machines, separately measure whether single-user p95 and concurrent throughput meet targets.
Product pages and user guides change, so record the review date and pin exact DGX OS, driver, CUDA and firmware versions. Check known issues and unified-memory reporting changes in release notes, and preserve the previous image and model artifacts before updating. After updating, retest in order: small sample, target model, then boundary workloads. If problems occur, verify that the same requests recover on the previous system image.
Why does this happen?
This is because product capability is a combination of specific architecture, memory, power, software, and artifact conditions, and parameter counts alone cannot determine execution results.
When is it a problem?
Treating a maximum-model claim as a purchase guarantee can mean the actual artifact and context do not fit, or that speed, quality, and dual communication miss their targets.
Common beginner misconceptions
The DGX name does not mean the same HBM and x86 environment as datacenter GPUs, nor that every model up to 200B runs with the same speed and features.
How to verify it yourself
On the exact DGX OS, firmware, container, model, precision, and context, save file bytes, peak usage, quality, and p95 separately for the official example and for your workload.
Conceptual explanation 05
Verify the full workflow compatibility of the ARM64 host and NVIDIA software stack
The DGX Spark CPU is ARM64. Even if the model server provides an official ARM image, surrounding Python wheels, the vector database, OCR, audio codecs, and custom CUDA extensions may provide only x86_64 binaries. Check container manifests and package wheel tags, and investigate whether multi-arch images or source builds are available. Do not move an entire RAG or agent workflow based only on “CUDA support.”
For example, even if model generation works, the user's task is not complete if the document parser does not run or the browser automation image is missing. List in the manifest not only the model runtime but also the ingestion, embedding and reranker, database, API gateway, and monitoring components. Record each component's architecture, version and license, test command, and fallback path, and run a small end-to-end request.
Building from source is a solution, but compiler and library versions and build time become a new operational burden. If you use a low-performance fallback or an unsupported patch, you may have to rebuild at every upgrade. Preserve the build recipe and hash, the cache and artifact store, and failure logs, and reproduce the build on a clean machine or container. Do not record community patches as having the same status as official NVIDIA support.
Start recovery with a known official container and a small sample, then add surrounding components one at a time. Do not upgrade system packages, the container base, and application dependencies together. Check whether the same input passes on the x86 baseline and find the first failing component on the ARM candidate. For a production candidate, also record in the approval sheet who owns dependency updates, rollback to the previous image, and the limits on delayed security updates.
Why does this happen?
Because an LLM service depends on host binaries and native extensions outside the GPU runtime, and if the instruction set differs, the package itself may not run.
When is it a problem?
If only the model demo is made to succeed, x86-only components in the actual RAG·agent·media workflow may not surface as blockers until after purchase.
Common beginner misconceptions
Being a CUDA application does not mean every x86 container or wheel runs unchanged on ARM64 regardless of host architecture.
How to verify it yourself
Check image architecture, wheels, and native extensions in the end-to-end component inventory, and reproduce normal and failing requests in a clean ARM environment.
Conceptual explanation 06
For Ryzen AI Max+, separate the processor maximum from the exact finished product and its ROCm path
The official AMD Ryzen AI Max+ 395 page lists a 16-core Zen 5 CPU, Radeon 8060S, 256-bit LPDDR5x, up to 128GB, and 45–120W configurable TDP. These maxima are not the actual configuration of every laptop and desktop. Check vendor-selected 32, 64, 96, or 128GB memory, speeds, channels, cooling, and power profiles on the exact product page. Soldered memory is often not upgradeable after purchase, so conservatively account for future workloads.
Exact system documentation, such as for the AMD Halo developer platform, may specify a combination of 128GB, 256GB/s, and 120W. These are official conditions for that platform and must not be applied unchanged to other Ryzen AI Max+ products. Locally measure firmware GPU-memory allocation or dynamic behavior, memory left by the OS, and display usage. Do not equate “up to 128GB” with “the GPU has exclusive use of 128GB.”
For ROCm, check the exact APU·OS·driver·release·framework matrix. Seeing Radeon 8060S or running Vulkan GGUF does not establish official support for PyTorch training·vLLM. llama.cpp HIP·Vulkan, Ollama, and frameworks differ in operator·quant·multi-user features. Check the target application’s startup logs, device placement, and CPU fallback.
Do not change TDP, memory allocation, and backend all at once; expand step by step from a small supported model. Do not mix Linux and Windows results, and if you use a workaround, record the support gap and the upgrade and rollback costs. The processor's large memory delivers real value only when the exact model's quality, p95, memory pressure, and 30-minute sustained results meet the targets.
Why does this happen?
Because the maximum allowed by the processor vendor and the finished-product manufacturer's combination of memory·power·cooling and software release are separate decisions.
When is it a problem?
Buying based only on the CPU name can leave you with insufficient product memory, an unsupported target framework, or low sustained performance due to thermal limits.
Common beginner misconceptions
It is incorrect to assume that every product with Ryzen AI Max+ 395 has 128GB of memory, identical bandwidth, and a 120W power rating, or that every ROCm application is automatically supported.
How to verify it yourself
Link the exact product's RAM, speed, power, and firmware, the ROCm matrix row, the runtime device log, and a 30-minute workload in a single manifest.
Conceptual explanation 07
Verify Apple Silicon by exact chip, unified memory option, and MLX or Metal path
Apple’s official Mac Studio specifications show differing M4 Max and M3 Ultra configurations, GPU cores, unified-memory options, and bandwidth figures such as 410, 546, and 819GB/s. Record the exact chip, GPU, memory, storage, and macOS version rather than only “Mac Studio 128GB.” Do not directly convert official bandwidth into your model’s tokens/s; measure effective throughput with the same artifact and context.
Official Apple MLX documentation describes a model in which Apple Silicon CPUs and GPUs access unified-memory arrays. MLX LM provides loading, generation, and fine-tuning tools, but exact architecture, quantization, and feature support must be checked by version. Do not treat MLX artifacts, GGUF files, and Hugging Face checkpoints as identical files; record source revisions, conversions, and hashes.
CUDA-only containers, custom extensions, and some server frameworks do not run directly on macOS or Metal. Moving to another runtime may change APIs, batching, structured output, quant, and quality. Convenience for individual inference does not establish multi-user production support. Inventory the required components and test the actual macOS-native, container-VM, or external-service path end to end.
For recovery, pin the exact macOS, MLX, and model bundle, and expand from a small sample to the task model, maximum context, and then LoRA or serving. If quality or latency changes after an OS update, do not replace the model and runtime together. Confirm that the same failing input recovers with the previous environment and artifact, and if a CUDA-only dependency is required, put the Mac candidate on hold or design a separate NVIDIA node.
Why does this happen?
Apple Silicon performance, capacity, and software capabilities are determined by the combination of chip, memory option, macOS, and MLX/Metal runtime.
When is it a problem?
Looking only at memory GB, you may discover a low-bandwidth configuration, a CUDA-only dependency, or missing serving features only after purchase.
Common beginner misconceptions
Not every Mac Studio has the same bandwidth or GPU, and unified memory does not mean CUDA software runs without translation.
How to verify it yourself
Record the exact chip, memory, bandwidth, macOS, MLX/llama.cpp version and artifact, end-to-end dependencies, and task quality/p95 together.
Conceptual explanation 08
Approve inference, LoRA, and serving with separate memory, storage, and operational tests
The inference ledger includes weights, KV cache, and runtime workspace. LoRA and QLoRA add activations, trainable parameters, gradients, optimizer state, and batches, and full fine-tuning is far larger in scope. For example, if an official "fine-tune up to N B" claim exists, check the method, precision, sequence length and batch, adapter rank, and checkpoint conditions. Running one step is different from completing the target dataset within the time and quality gates.
Base models, quantized variants, adapters, optimizer checkpoints, datasets, and evaluation outputs accumulate in storage. Check internal SSD capacity, sustained writes, free space, and encryption, and measure download, load, and checkpoint times. If the system disk and the only artifact copy are in the same box, a failure can lose both. Actually restore the exact model, configuration, and data excluding secrets from an external or network backup, then verify hashes and completion time.
A service needs authentication, rate limits, queuing and admission control, log privacy, and monitoring. After a restart, measure model warm-up, memory fragmentation under concurrent contexts, p95 and p99, and the error rate. A single compact box is a single point of failure for network, power, and hardware, so depending on the target availability, keep a spare, a cloud fallback, or a small emergency model. Do not present success on a personal desktop as production readiness.
For each purpose, run normal·boundary·failure workloads at least 3 times and record quality, load·job·p95 times, memory·storage peaks, power·temperature, and errors. Deliberately recover from training OOM, disk full, network loss, and service restart. Approve the change only when the same job or request recovers on the previous hardware·cloud, and keep any purpose that did not pass on hold separately.
Why does this happen?
Because inference, training, and serving differ in resources beyond weights, such as activations, optimizer state, checkpoints, queues, and availability.
When is it a problem?
Testing only the model load means OOM·disk-full failures during training or concurrent-service p95·restart incidents are first encountered in real use.
Common beginner misconceptions
Being able to run inference on a large model does not automatically make full fine-tuning at the same size or a 24-hour multi-user service possible.
How to verify it yourself
For each purpose, run the exact recipe on normal, boundary, and failure workloads, and test memory, storage, time, quality, and recovery separately.
Conceptual explanation 09
Complete the purchase comparison sheet as an exact configuration, evidence, and rollback contract
Rows in the comparison table are not generic DGX Spark, AMD APU, or Mac entries but exact model, memory, and storage configurations combined with OS, firmware, runtime, and artifact. Columns hold official memory, bandwidth, and power sources, usable memory and effective bandwidth, architecture and dependencies, quality, p95, job time, 30-minute sustained rate, and recovery. Keep official peaks and local measurements in separate columns, and do not fill unconfirmed values with estimates.
A price is a quote tied to region·tax·stock·warranty and date. In addition to the system price, include storage·network, monitor·UPS, backup·spares, power, and time for software porting·maintenance. Because prices change often, do not fix a permanent price ranking in the text. Compare cost per workload and 2~3-year scenarios only among candidates that pass every mandatory gate.
Defects and failures are evidence too. Record conditions such as a model loading but decoding at 3 tokens/s, unsupported ARM dependencies, gaps in the ROCm matrix, or missing CUDA-only features. If you recover using a smaller model or different runtime, reassess quality and operational features. Do not lower acceptance thresholds after seeing results or delete failure screenshots and logs.
Before approval, restore the same failing input or training job on the previous hardware or cloud. Record the system image, model and adapter hashes, config and build recipe, backup restore, and responsible owner in the runbook. When the OS, driver, runtime, model revision, context, concurrency, or task rubric changes, recheck the official documentation and rerun regression tests. The conclusion should not be which brand is best but a pass or hold record tied to the exact workload and date.
Why does this happen?
Products, software, prices and tasks change, so recommendations cannot be reproduced or updated without exact configurations and evidence of failure and recovery.
When is it a problem?
Keeping only best values and successful results hides dependency, sustained-load and failure regressions, and loses causes and recovery paths after updates.
Common beginner misconceptions
A brand ranking or price/performance score made once does not permanently apply to every purpose, region and version.
How to verify it yourself
Independently review whether a different owner can reproduce the same pass or hold using only the official source, manifest, commands, failing inputs, and rollback artifact.
CONCRETE CASES
Check concepts in different situations
Before memorizing definitions, compare how these concepts appear on a personal PC and in real work.
Case 1 · Define the role of a personal AI system before choosing products
A personal 70B Q4 chat and a 14B model API serving eight concurrent users may need similar memory, but their throughput and operational requirements are completely different.
Key points to check here: Define the exact model, precision, context, concurrency and required quality before choosing equipment candidates.
Case 2 · Distinguish unified-memory capacity from bandwidth and contention
Even on a 128GB unified system, after 8GB for the OS·display, 82GB for weights, 20GB for KV·workspace, and 12GB of headroom, only 6GB remains for increasing concurrency.
Key points to check here: Subtract OS, display, application, cache, workspace and safety headroom separately from total product memory.
Case 3 · Interpret DGX Spark ARM64 and CUDA conditions and maximum-model claims
Do not treat the official hardware documentation's support for up to 200B as a guarantee of practical chat speed or full fine-tuning for every 200B model.
Key points to check here: Record official maximum model figures as a conditional capability tied to exact precision, software, and workload.
Case 4 · Compare Ryzen AI Max+ and Apple Silicon by memory and runtime path
Even within the same 128GB class, the official figures of 256GB/s for the AMD Halo platform and 410·546·819GB/s for each Mac Studio chip reflect different system conditions; measure actual token/s separately.
Key points to check here: Distinguish the processor's maximum memory from the actual finished product's configuration and firmware GPU allocation.
Case 5 · Approve inference, LoRA, and multi-user operation separately
Even if a single-user 70B Q4 chat passes, that does not automatically approve 14B BF16 LoRA or the p95·availability for eight concurrent users.
Key points to check here: Spell out the claim “training is possible” as full training and the precision, batch, and checkpoint conditions for LoRA and QLoRA.
CHAPTER 1 / 5
Define the role of a personal AI system before choosing products
“Personal AI box” groups together compact desktops, high-memory Accelerated Processing Units (APUs, devices integrating a CPU and GPU in one package), Apple Silicon workstations, and dedicated NVIDIA systems. Similar appearances do not mean the same CPU instruction set, memory architecture, accelerator, operating system, or available runtime. Replace “Which product is best?” with “Which system reproducibly passes the exact model·artifact·precision, context·concurrency, target task, and latency·quality requirements?”
Separate the purpose into inference, fine-tuning, and serving. Interactive inference for one user only needs to hold large weights and decode fast enough, but LoRA needs optimizer states, gradients, activations, and checkpoints in addition to the base weights. A multi-user API requires queuing, continuous batching, authentication and monitoring, and failover. Even if product copy says one machine can do all three, that does not mean it does them with the same model size and speed.
The workload manifest includes exact model revisions and file bytes, tokenizer and template, quantization or training precision, maximum input and output tokens, batch size, concurrency, and normal, boundary, and failure inputs. Define required quality, p95 TTFT or job-completion time, memory and power limits, and recovery time before examining hardware. Comparing only product-specific demo peaks or different quantizations cannot separate system differences from artifact differences.
Preserve a baseline that passes essential quality on the current CPU, GPU or cloud. Define what the new box must solve, such as loading a larger model, LoRA time at most 8 hours, keeping personal documents local, or office noise limits, and hold it if those needs are not met. Testing recovery of the same failing inputs on the previous backend makes the new system a reversible operational change rather than just a purchase.
To recap the key points
Define the exact model, precision, context, concurrency and required quality before choosing equipment candidates.
Record whether stopping is acceptable when one machine fails, and the recovery paths to cloud or existing hardware.
How this connects in practice
A personal 70B Q4 chat and a 14B model API serving eight concurrent users may need similar memory, but their throughput and operational requirements are completely different.
CHAPTER 2 / 5
Distinguish unified-memory capacity from bandwidth and contention
In a discrete GPU system, CPU RAM and VRAM are separate, and data moves over links such as PCIe. In a unified memory system, the CPU and GPU can access data in the same physical memory pool, so large models can be placed more easily than under a separate VRAM limit. However, “shared” does not mean every byte is always GPU-dedicated or that copying, page migration, and synchronization cost nothing. Check the actual programming model and the runtime's allocation and execution logs.
Total system memory is shared by the operating system, desktop display, filesystem cache, tokenizer and application, model weights, KV cache, activations and workspace, and other processes. As DGX Spark's official release notes show, on a unified architecture, memory reporting and display-reserved memory can also vary with the software version. Do not treat the product's 128GB as room for a 128GB weight file; measure the full host and device peak at startup, load, prefill, decode, and training steps.
Capacity and bandwidth are different limits. Even if large weights fit, reading many bytes per decode step can make memory bandwidth the ceiling for token/s. CPU preprocessing, GPUs, and NPUs sharing one pool, alongside other applications, also creates contention. Official bandwidth is a hardware upper bound; measure the exact model/runtime's effective bandwidth, cache reuse, and power state with a profiler.
Start recovery from a passing baseline with a small model, short context, and concurrency 1. When OOM, swap, or memory pressure appears, do not change the model, quant, context, batch, and GPU allocation at the same time. Lower one item at a time and check whether the same failing workload recovers. If swap merely keeps execution alive, judge separately whether p95 and storage writes meet operational targets.
How to read the figure Unified memory gathers the capacity into one pool, but it does not pool the bandwidth or the contention. Write the capacity verdict and the speed verdict separately.
To recap the key points
Subtract OS, display, application, cache, workspace and safety headroom separately from total product memory.
Unified memory does not mean infinite bandwidth or the disappearance of data movement and synchronization.
How this connects in practice
Even on a 128GB unified system, after 8GB for the OS·display, 82GB for weights, 20GB for KV·workspace, and 12GB of headroom, only 6GB remains for increasing concurrency.
CHAPTER 3 / 5
Interpret DGX Spark ARM64 and CUDA conditions and maximum-model claims
The official NVIDIA DGX Spark hardware documentation specifies the Grace Blackwell architecture, a 20-core ARM CPU, 128GB LPDDR5x unified system memory, and 273GB/s bandwidth. These numbers are structural facts about that exact system, and they cannot be taken to mean the same bandwidth as GDDR VRAM on a desktop RTX or datacenter HBM. Include the 240W power supply and 140W GB10 TDP conditions, 10GbE·ConnectX-7, and storage in the actual placement·network workflow as well.
Official statements such as “up to 200B models” and “405B with dual systems” are capability upper bounds. Without specifying model family, precision, context, batch, and software for loading or execution, Korean quality, tokens/s, and p95 remain unknown. Parameter count differs from artifact bytes, and MoE total weights, KV cache, and runtime workspace must be accounted for separately. Reproduce the official example at an exact version, then substitute your own artifact and task evaluation.
The host CPU being ARM64 matters. Even with CUDA, x86_64-only wheels, container images, custom extensions and closed binaries may not run unchanged. Check architectures in NVIDIA's porting guide and image manifests, and prepare a multi-architecture or source-build path. Even if the model computes on the GPU, the overall workflow is incomplete if the host architecture blocks the tokenizer, database, OCR or vector extension.
Pin DGX OS, driver, CUDA, and firmware as a release. Before updating, review known issues, memory reporting, and container compatibility in the official release notes, and preserve the previous image and model artifacts. Expand step by step from a small official sample to the target model, maximum context, LoRA, and then service, and never update the system and change the model at the same time. Approve the upgrade only after confirming that the same failing input recovers on the previous runtime.
To recap the key points
Record official maximum model figures as a conditional capability tied to exact precision, software, and workload.
Use the porting guide to check whether x86_64-only binaries, containers, and native extensions work on ARM64.
How this connects in practice
Do not treat the official hardware documentation's support for up to 200B as a guarantee of practical chat speed or full fine-tuning for every 200B model.
CHAPTER 4 / 5
Compare Ryzen AI Max+ and Apple Silicon by memory and runtime path
The official AMD Ryzen AI Max+ 395 processor page lists a 16-core x86 CPU, Radeon 8060S integrated GPU, 256-bit LPDDR5x, up to 128GB, and 45–120W configurable TDP. Processor maxima do not define the actual RAM, bandwidth, and power configuration of every laptop or desktop. For example, the AMD Halo developer platform separately specifies 128GB, 256GB/s, and 120W. Check soldered memory, firmware GPU allocation, and cooling for the exact finished system being purchased.
Verify AMD software support using the exact APU, OS, driver, ROCm, and framework matrix. An integrated GPU appearing in a device list or a Vulkan GGUF running does not establish PyTorch or vLLM ROCm support. llama.cpp HIP and Vulkan, Ollama, and other frameworks differ in artifacts, operators, and features. Check device placement and CPU fallback in startup logs, and keep Windows and Linux results separate.
Apple's official Mac Studio specifications show that unified memory and memory bandwidth differ by chip configuration. Apple MLX provides a programming model in which the CPU and GPU access unified memory arrays, and MLX LM is an execution path for models on Apple Silicon. CUDA-only images and x86 extensions are not directly compatible, so check which artifacts and features MLX, Metal, and llama.cpp support. Even at the same GB, do not merge the GPU, bandwidth, and memory options of the M4 Max and M3 Ultra into one row.
Compare the three ecosystems using architecture, exact memory/bandwidth, OS, primary runtime/artifact, unsupported dependencies, loading/prefill/decode peaks and sustained power. Do not compare one system's officially stated maximum model against another as though precision and speed were identical. If the same high-precision artifact cannot be used, disclose artifact differences and quality effects and run a common CPU or cloud baseline.
How to read the figure Even with the same 128GB capacity, different memory bandwidth and software paths mean different systems. Approve a purchase only when memory, software, workload, and rollback are all connected for the chosen candidate.
To recap the key points
Distinguish the processor's maximum memory from the actual finished product's configuration and firmware GPU allocation.
Verify the exact runtime and operators instead of assuming a CUDA-only dependency will run after simply renaming it.
How this connects in practice
Even within the same 128GB class, the official figures of 256GB/s for the AMD Halo platform and 410·546·819GB/s for each Mac Studio chip reflect different system conditions; measure actual token/s separately.
CHAPTER 5 / 5
Approve inference, LoRA, and multi-user operation separately
Inference mainly requires weights, KV cache and workspace. LoRA/QLoRA also require activations, gradients, optimizer state and dataset batches in addition to trainable adapters. Full fine-tuning requires much more memory and compute. For claims such as '70B fine-tuning supported', check the method, precision, sequence length, batch, checkpoints and expected job duration. Browser calculations or parameter names alone do not guarantee overnight-job success or quality.
Storage is part of the workload. Multiple quantized variants, base models, adapters, checkpoints, datasets, and evaluation outputs can quickly fill an internal SSD. Test download and load times, free space during checkpoint writes, and failure recovery. Record artifact hashes, licenses, encryption, and backup locations. If the system has only one internal SSD, determine whether system failure and model-data loss share a failure domain, and test actual restoration from an external or network backup.
For multi-user services, admission control, queue time, p95, p99, error rates, and memory fragmentation matter beyond single-prompt tokens/s. Include authentication, rate limits, log privacy, monitoring, and model warm-up after restart. A single personal desktop is convenient but creates hardware, power, and network single points of failure. If recovery-time targets cannot be met, prepare a spare, cloud fallback, or smaller emergency model.
For final approval, repeat inference, training and service tests at least three times each on normal, boundary and failure workloads, recording quality, time, memory, power, temperature, errors and cost. Roll back to previous hardware or the cloud and verify recovery of the same failing jobs and requests. Do not justify purchase with one successful load; record which purpose-specific gates the exact system, software and artifacts passed, as well as purposes not passed.
To recap the key points
Spell out the claim “training is possible” as full training and the precision, batch, and checkpoint conditions for LoRA and QLoRA.
If a single personal workstation serves as a production service, add authentication, queuing, backups, spares, and recovery time.
How this connects in practice
Even if a single-user 70B Q4 chat passes, that does not automatically approve 14B BF16 LoRA or the p95·availability for eight concurrent users.
INTERACTIVE LAB 1 / 2
Lab 1 · AI system memory and compatibility approval lab
Enter values in the browser and check the execution results and the failure and recovery paths. No commands are ever sent to real equipment or the NAS.
Approving unified memory, architecture, and runtime fit
Assess the post-OS-reservation memory budget, host architecture, exact runtime, artifacts and rollback together, rather than the product’s maximum-model claim. The defaults deliberately fail.
Situation
Loading 82GB of weights on a 128GB system was approved, but memory pressure appears at maximum context and nearby x86-only components do not run.
Goal
Combine system reservations, weights, cache, headroom, and end-to-end architecture and runtime compatibility into a single gate.
Prerequisites
Prepare exact system specifications, startup, load, prefill, and decode or training peaks, image and wheel architecture, runtime placement, and the previous backend.
Success criteria
Workload memory is at or below the space remaining after system reservations, and the exact configuration, host dependencies, runtime operators, and rollback are all verified.
Select and enter the exact system configuration and the OS, display, and application reservations.
Enter the artifact weights, cache and workspace at maximum load, and actual variable headroom.
Run the AI system suitability gate Then change only one of the model, context, or system candidates and recover the same failing workload.
Evidence limits: System options are exact examples for structural comparison; actual product configurations and supported releases may change. Passing browser checks is not evidence from hardware, memory profiling, or architecture and runtime execution.
INTERACTIVE LAB 2 / 2
Lab 2 · Operation and recovery approval lab by purpose
Enter values in the browser and check the execution results and the failure and recovery paths. No commands are ever sent to real equipment or the NAS.
Approve sustained operation and recovery for inference, LoRA, and serving
Select a purpose and judge quality, p95 or job criteria, memory and 30-minute sustained performance, and end-to-end dependencies, backup, and rollback. The defaults fail on purpose.
Situation
The model demo succeeded once, but the actual RAG service has poor quality·p95 performance, throughput declines over long runs, and there is no backup outside the internal SSD.
Goal
Approve quality, performance, memory, storage, and failure recovery for the exact purpose: inference, training, or serving.
Prerequisites
Prepare the same artifact and task set, cold, warm, and 30-minute results from 3 runs, end-to-end components, backup restore, and the previous backend.
Success criteria
Quality, p95/job, memory, and sustained throughput pass, and the full workflow, independent backup restore, and rollback are reproduced.
Before seeing results, set the purpose, the quality, p95, or job target, and the system memory reservation.
Enter peak values, performance retention over 30 minutes, and results from at least three runs for normal, boundary and failure workloads.
Run operational and recovery gates Then change only one of the artifact, system, or runtime without lowering targets.
Evidence limits: Browser inputs and checkboxes only rehearse the operational decision procedure; they do not produce an actual system, workload, power and temperature data, backup restore, or rollback log.
KEY TERMS
Key terms in this unit
Unified memory
A structure where CPU and GPU access one physical memory pool, requiring per-runtime verification of actual allocation, synchronization, and contention among the OS and applications
Memory bandwidth
The amount of data that can be read from and written to memory per second; a metric that distinguishes the official peak from the effective value for the workload
ARM64
A host condition for the 64-bit Arm instruction set architecture used in systems such as DGX Spark, which requires separately checking compatibility with x86_64-only binaries and containers
Failure domain
Scope of hardware, storage, and network that a single failure affects at once; the boundary needed to design recovery and backup for a single box
UNIT WORKBOOK
Exercises and worksheets for applying concepts to new situations
Start by checking basic principles, then expand to practical workplace decisions. After submitting an answer, you can see why every option is correct or incorrect, not just the correct answer.
Basic Question 1
A 128GB unified memory system needs 82GB for weights, 22GB for KV·workspace, and 12GB of headroom, and 12GB is reserved for the OS·applications. What is the most accurate assessment?
Basic Question 2
What is the safest way to record the “supports models up to 200B” statement from the official DGX Spark documentation in training and procurement tables?
Apply Question 3
Model generation runs on DGX Spark, but an internal RAG vector-database extension provides only x86_64 images and cannot run. What is the first response?
Apply Question 4
Can Ryzen AI Max+ and Mac Studio candidates be compared as the same system just because both have 128GB?
Capstone Question 5
Which purchase plan is most complete for an AI box used for personal RAG development and an internal multi-user API?
Requirements are 95% citation quality, p95 of 2 seconds, at least 85% sustained throughput over 30 minutes, independent backup restoration and rollback to the existing cloud setup.
PERSONAL WORKSHEET
A learning worksheet you adapt to your own environment
Your input remains only on the current browser screen and is not stored or transmitted externally. Use categories and pseudonyms instead of actual sensitive information.
OFFICIAL SOURCES
Verify against official sources
Technical, compatibility, and model information reviewed: August 2026