KoreaDevKNOWLEDGE SHARING

Content typeLearn

AI INFRASTRUCTURE · 07 / 12

Kubernetes and K3s

Deploy container workloads as declarative state and diagnose network, storage, and failure issues on single-node and multi-node clusters.

Difficulty
Intermediate
Structure
Core units 4 · Judgment activities · Three-stage assessment

NEW HIRE ONBOARDING

Start in the order you would receive your first assignment

So that even a new hire with no prior IT background can follow along, we start with the situation, the task, the evidence, and when to report, before difficult definitions.

  1. 01

    Read the situation in one sentence

    Connect API objects, controllers, the scheduler, kubelet, CNI/Service/Ingress, CSI, and the datastore through the conditions and events at each layer.

  2. 02

    Today's assignment

    Write the stop conditions and recovery evidence for Storage and cluster operations into a work record.

  3. 03

    Evidence that shows the work is complete

    Reviewed against official documentation and training output. Commands and performance tests on real hardware are unconfirmed.

  4. 04

    When to stop and ask a senior colleague

    The Deployment is Available, but external requests return 503. What is the first diagnostic step?

Unpack unfamiliar terms first

Reconciliation
The behavior of a controller that continuously reduces the gap between the desired state and the observed state.

Operational question for this course

How do you prove that the desired state has converged all the way to actual user requests?

Connect API objects, controllers, the scheduler, kubelet, CNI/Service/Ingress, CSI, and the datastore through the conditions and events at each layer.

CORE UNIT 1 / 4

Kubernetes objects and the control loop

Explain the process by which the desired state and the actual state converge.

Difficulty
Intermediate
Structure
Lessons 5 · Labs 2 · Assessment

Diagrams and tables: composed by the author using each lesson's official primary sources. Find the originals and review dates at the end of that lesson.

PREREQUISITE CHECK

Three things to check before reading

This is not a test of memorized answers. Think about each question first, then open the explanation to review the foundational concepts used in this course.

1Does this unit send commands to real equipment?

No. Read the training output in the browser and make the judgment there. Any separate reproduction is done only in an approved isolated environment.

2What permissions and environment must you confirm before the lab?

Dedicated lab cluster-admin · no production credentials. Isolated cluster CIDR, service CIDR, and documentation-only ingress address.

3How do you record a value you have never seen before and a test you have not yet run?

Record it as unconfirmed. Distinguish expected training output from actual measurements, and do not fill in blanks with unapproved work.

TEXTBOOK GUIDE

Main text that covers each concept from its background to the criteria for judging it

We explain the material section by section so readers new to IT can connect causes and effects without memorizing terms.

  1. Explain the components and failure boundaries of Kubernetes objects and the control loop with a diagram.
  2. Judge the state of Kubernetes objects and the control loop from command output and observed values.
  3. Write the stop conditions and recovery evidence for Kubernetes objects and the control loop into a work record.
Kubernetes objects and the control loop Lab environment and safety boundaries
Hardware3-node VM fixture · no load balancer
SoftwareUbuntu 24.04·K3s v1.31.x fixture·kubectl
Required permissionsDedicated lab cluster-admin · no production credentials
NetworkingIsolated cluster CIDR · service CIDR · documentation ingress address

Reviewed against official documentation and training output. Commands and performance tests on real hardware are unconfirmed.

Applies to version: Kubernetes 1.31 API fixture · K3s v1.31.x+k3s1 fixture · Manuscript review date: 2026-09-01

CONCEPT FLOW

How the chapters connect

The chapters are not isolated short answers to memorize. Follow them from left to right to see how each chapter's concepts support the next decision.

  1. 1.Start the checks at the API spec
  2. 2.Pins down the lab target for the controller
  3. 3.Distinguishes scheduler output from its meaning
  4. 4.Decides whether the kubelet proceeds or stops
  5. 5.Re-verify recovery of Kubernetes objects and the control loop
Kubernetes objects and the control loop: the overall map. If you lose track while reading the detailed explanations and chapters below, return to this sequence.

CONTROLLED EXPLANATION

Follow the evidence to check, one step at a time

Current explanation · 1/5 · Start the checks at the API spec

Up next: Pins down the lab target for the controller

  1. Start the checks at the API spec

    Do not guess the cause and start by changing settings. If you group the following evidence into records from the same time window, another operator can reproduce the boundary at which the expected state broke.

  2. Pins down the lab target for the controller

    Lab scenario:: In a fixture where 3 replicas were requested but only 2 are Ready, determine which control loop is blocked. Instructions:: In the browser, read the training output below and write a verdict. Do not send the commands to real equipment. To reproduce the commands separately, prepare an approved isolated environment with the relevant tools and example files. Save the entire output, and if observedGeneration lags or a condition fails, do not move on to the next change.

  3. Distinguishes scheduler output from its meaning

    The point is not to memorize the values themselves but to confirm that the controller observed the latest spec and that the scheduler stopped at the resource shortage boundary. The values shown are reproduced examples for training, not measurements taken on real equipment. Identifiers and values can differ by device, driver, and cluster.

  4. Decides whether the kubelet proceeds or stops

    Success means using object ownership, conditions, and events to record exactly which controller failed and who owns the next step. Record the execution time, target identity, commands used, key output, verdict, and next action together in the result.

  5. Re-verify recovery of Kubernetes objects and the control loop

    Preserve the failure reason, then fix one boundary among quota, request, and node capacity. Confirm again that the spec generation increased and that observedGeneration and Ready converged. After recovery, measure again with the same commands and the same success criteria. Do not close an incident just because things appear normal.

Conceptual explanation 01

Trace reconciliation from the API object to the Pod condition

Reconciliation: the behavior of a controller that continuously reduces the gap between the desired state and the observed state.

Kubernetes is not a tool that sends commands straight to nodes; it is a system in which the desired state is written to API objects and many controllers converge the actual state onto it. spec, status, condition, and event are different pieces of evidence.

The Deployment controller creates a ReplicaSet, the scheduler picks a node for unscheduled Pods, and the kubelet reconciles the container runtime with the actual Pod. Success at one controller does not guarantee success at the next boundary.

Do not conclude that everything is fine from the few columns of kubectl get. Read how far the control loop has progressed from generation, observedGeneration, condition reasons, events, and owner references.

In the training example replicas was submitted as 3 and the API write succeeded, but only 2 Pods are Ready. A success response from the API means the request was accepted, not that all of the desired workload is available. Read the scheduling events of the pending Pod and the readiness of the existing replicas to find the layer where the gap appeared. Manually deleting Pods that the controller recreates does not change the desired state.
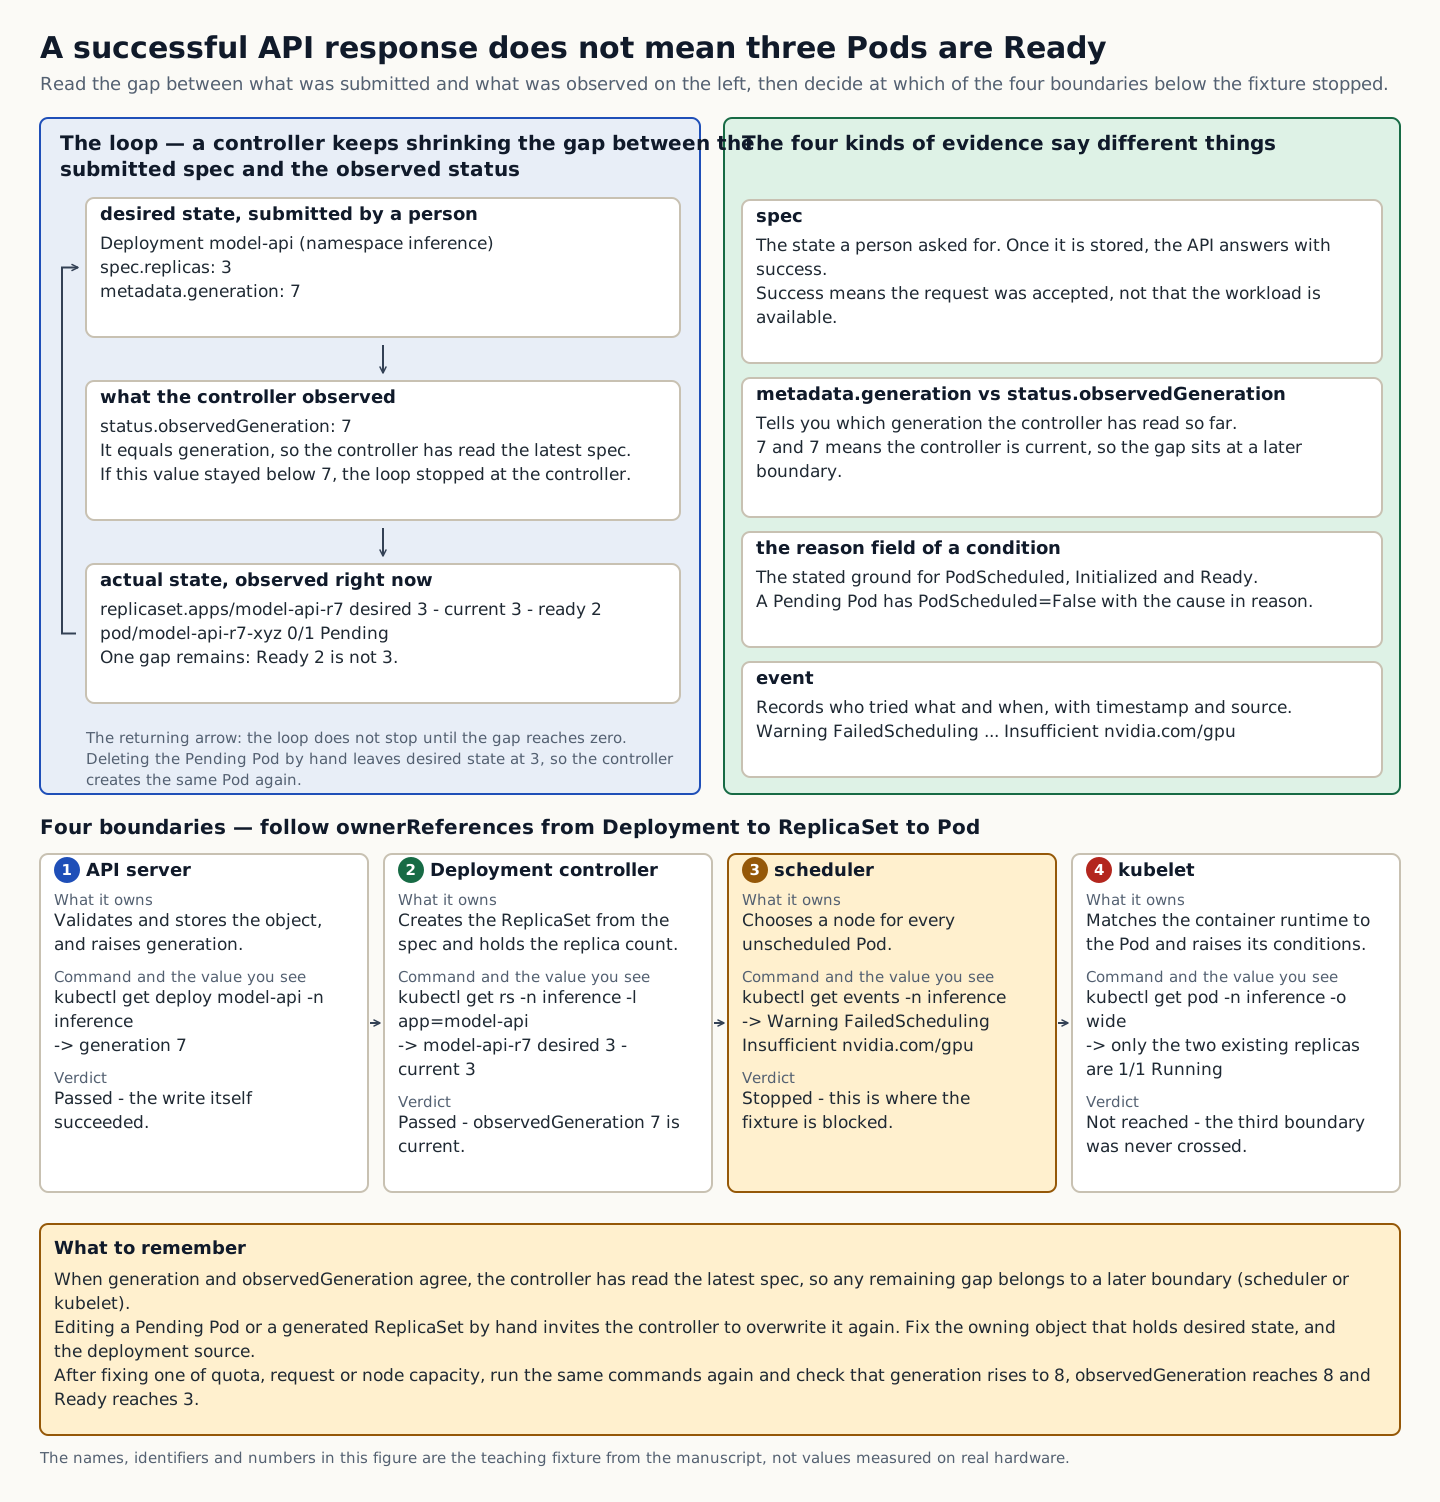
A figure showing the reconciliation loop that reduces the gap between the submitted spec and the observed status, along with a verdict on where the fixture stopped among four boundaries: API server, Deployment controller, scheduler, and kubelet
How to read the figure Read the loop in the blue box on the left from top to bottom. It moves from the submitted spec (spec.replicas 3 · metadata.generation 7), through status.observedGeneration 7 as observed by the controller, down to the current actual state (ready 2 · 1 Pending Pod); the returning arrow means the loop does not stop until the difference reaches zero. The green box on the right distinguishes what each of the four kinds of evidence tells you: spec · generation, observedGeneration, the condition's reason, and event. The four boxes below show the boundary order down ownerReference from Deployment → ReplicaSet → Pod, and each box has three cells: what it is responsible for, the check command and observed value, and the verdict. Reading only the verdict lines shows that 1 and 2 pass, 3 (scheduler) is stopped at Insufficient nvidia.com/gpu, and 4 (kubelet) is never reached. The fill color of the third box is only for emphasis, and the same verdict can be read without distinguishing colors. The last box records where to fix the problem (the higher-level object that owns the desired state, and the deployment source) and the values to check again after the fix (generation 8 · observedGeneration 8 · Ready 3). The names · identifiers · numbers in the figure are a training fixture, not values measured on real equipment, and the figure does not depict time proportions or physical cabling. Source: composed by the author based on Kubernetes Controllers · Kubernetes Deployments.
Why does this happen?
The Deployment controller creates the ReplicaSet, the scheduler picks a node for unplaced Pods, and the kubelet works with the container runtime to bring the actual Pod into line. Success in one controller does not guarantee success at the next boundary.
When is it a problem?
If observedGeneration lags or a condition fails, there are insufficient grounds to proceed.
Common beginner misconceptions
If you edit a generated ReplicaSet or Pod directly, the controller may overwrite your change. Fix the higher-level object that owns the desired state, along with the deployment source.
How to verify it yourself
Compare metadata generation with status observedGeneration. Trace the Deployment→ReplicaSet→Pod relationship through ownerReferences.
To summarize this sectionYou succeed when you use object ownership and conditions/events to name the failing controller and the next owner precisely.

CHAPTER 1 / 5

Start the checks at the API spec

Do not guess the cause and start by changing settings. If you group the following evidence into records from the same time window, another operator can reproduce the boundary at which the expected state broke.

1. Compare the metadata generation with the status observedGeneration. 2. Trace the Deployment→ReplicaSet→Pod relationship through ownerReferences. 3. Read the reasons for the PodScheduled, Initialized, and Ready conditions. 4. Sort the events by timestamp and source to find repeated failures.
CHAPTER 2 / 5

Pins down the lab target for the controller

Commands for reproducing the isolated environment · do not run them in the browser
kubectl get deploy model-api -n inference -o jsonpath='{.metadata.generation}{" "}{.status.observedGeneration}{"\n"}'
kubectl get rs,pod -n inference -l app=model-api -o wide
kubectl get events -n inference --sort-by=.metadata.creationTimestamp

CHAPTER 3 / 5

Distinguishes scheduler output from its meaning

Expected output for training · not an actual measurement
7 7
replicaset.apps/model-api-r7  3  3  2
pod/model-api-r7-xyz  0/1  Pending ...
Warning FailedScheduling ... Insufficient nvidia.com/gpu

CHAPTER 4 / 5

Decides whether the kubelet proceeds or stops

CHAPTER 5 / 5

Re-verify recovery of Kubernetes objects and the control loop

CONCRETE CASES

In a fixture where 3 replicas were requested but only 2 are Ready, determine which control loop is blocked.

Do not conclude that everything is fine from the few columns of kubectl get. Read how far the control loop has progressed from generation, observedGeneration, condition reasons, events, and owner references.

Wrong responses and boundaries to check

If you edit a generated ReplicaSet or Pod directly, the controller can overwrite it again. Fix the higher-level object that owns the desired state and the deployment source.

Preserve the failure reason, then fix one boundary among quota, request, and node capacity. Confirm again that the spec generation increased and that observedGeneration and Ready converged. After recovery, measure again with the same commands and the same success criteria. Do not close an incident just because things appear normal.

INTERACTIVE LAB 1 / 2

Lab 1 · Find the basis for a verdict in the output

Enter values in the browser and check the execution results and the failure and recovery paths. No commands are ever sent to real equipment or the NAS.

Lab scenario:: In a fixture where 3 replicas were requested but only 2 are Ready, determine which control loop is blocked. Instructions:: In the browser, read the training output below and write a verdict. Do not send the commands to real equipment. To reproduce the commands separately, prepare an approved isolated environment with the relevant tools and example files. Save the entire output, and if observedGeneration lags or a condition fails, do not move on to the next change.

7 7
replicaset.apps/model-api-r7  3  3  2
pod/model-api-r7-xyz  0/1  Pending ...
Warning FailedScheduling ... Insufficient nvidia.com/gpu

The point is not to memorize the values themselves but to confirm that the controller observed the latest spec and that the scheduler stopped at the resource shortage boundary. The values shown are reproduced examples for training, not measurements taken on real equipment. Identifiers and values can differ by device, driver, and cluster.

INTERACTIVE LAB 2 / 2

Lab 2 · Plan for stopping and recovery

Enter values in the browser and check the execution results and the failure and recovery paths. No commands are ever sent to real equipment or the NAS.

If you edit a generated ReplicaSet or Pod directly, the controller can overwrite it again. Fix the higher-level object that owns the desired state and the deployment source.

KEY TERMS

Key terms in this unit

Reconciliation
The behavior of a controller that continuously reduces the gap between the desired state and the observed state.

UNIT WORKBOOK

Exercises and worksheets for applying concepts to new situations

Start by checking basic principles, then expand to practical workplace decisions. After submitting an answer, you can see why every option is correct or incorrect, not just the correct answer.

Write the stop conditions and recovery evidence for Kubernetes objects and the control loop into a work record.

PERSONAL WORKSHEET

A learning worksheet you adapt to your own environment

Your input remains only on the current browser screen and is not stored or transmitted externally. Use categories and pseudonyms instead of actual sensitive information.

OFFICIAL SOURCES

Verify against official sources

Reviewed against official documentation and training output. Commands and performance tests on real hardware are unconfirmed.

CORE UNIT 2 / 4

K3s and cluster build-out

Produces single-node and multi-node topologies and bootstrap evidence.

Difficulty
Intermediate
Structure
Lessons 5 · Labs 2 · Assessment

Diagrams and tables: composed by the author using each lesson's official primary sources. Find the originals and review dates at the end of that lesson.

PREREQUISITE CHECK

Three things to check before reading

This is not a test of memorized answers. Think about each question first, then open the explanation to review the foundational concepts used in this course.

1Does this unit send commands to real equipment?

No. Read the training output in the browser and make the judgment there. Any separate reproduction is done only in an approved isolated environment.

2What permissions and environment must you confirm before the lab?

Dedicated lab cluster-admin · no production credentials. Isolated cluster CIDR, service CIDR, and documentation-only ingress address.

3What evidence did you record in the previous unit, "Kubernetes objects and control loops"?

Success means using object ownership, conditions, and events to record exactly which controller failed and who owns the next step.

TEXTBOOK GUIDE

Main text that covers each concept from its background to the criteria for judging it

We explain the material section by section so readers new to IT can connect causes and effects without memorizing terms.

  1. Explain the components and failure boundaries of K3s and cluster build-out with a diagram.
  2. Judge the state of K3s and cluster build-out from command output and observed values.
  3. Write the stop conditions and recovery evidence for K3s and cluster build-out into a work record.
K3s and cluster build-out Lab environment and safety boundaries
Hardware3-node VM fixture · no load balancer
SoftwareUbuntu 24.04·K3s v1.31.x fixture·kubectl
Required permissionsDedicated lab cluster-admin · no production credentials
NetworkingIsolated cluster CIDR · service CIDR · documentation ingress address

Reviewed against official documentation and training output. Commands and performance tests on real hardware are unconfirmed.

Applies to version: Kubernetes 1.31 API fixture · K3s v1.31.x+k3s1 fixture · Manuscript review date: 2026-09-01

CONCEPT FLOW

How the chapters connect

The chapters are not isolated short answers to memorize. Follow them from left to right to see how each chapter's concepts support the next decision.

  1. 1.Start the checks from the prerequisites
  2. 2.Fix the lab target for the first server
  3. 3.Distinguishes node join output from its meaning
  4. 4.Make the go/stop decision on the bootstrap evidence
  5. 5.Re-verify recovery of K3s and cluster build-out
K3s and cluster build-out: the overall map. If you lose track while reading the detailed explanations and chapters below, return to this sequence.

CONTROLLED EXPLANATION

Follow the evidence to check, one step at a time

Current explanation · 1/5 · Start the checks from the prerequisites

Up next: Fix the lab target for the first server

  1. Start the checks from the prerequisites

    Do not guess the cause and start by changing settings. If you group the following evidence into records from the same time window, another operator can reproduce the boundary at which the expected state broke.

  2. Fix the lab target for the first server

    Lab scenario:: In the bootstrap plan for the 3-node fixture, find the duplicate hostname and the problem of server quorum nodes concentrated in a single rack. Instructions:: In the browser, read the training output below and write a verdict. Do not send the commands to real equipment. To reproduce the commands separately, prepare an approved isolated environment with the relevant tools and example files. Save the entire output, and if you see a hostname collision, time drift, or token exposure, do not move on to the next change.

  3. Distinguishes node join output from its meaning

    The point is not to memorize the values themselves but to confirm that identity, time, the API port, node conditions, and the datastore snapshot match the design. The values shown are reproduced examples for training, not measurements taken on real equipment. Identifiers and values can differ by device, driver, and cluster.

  4. Make the go/stop decision on the bootstrap evidence

    Success means submitting a per-node pre-check list, a role and failure-domain map, secret handling, and a plan for confirming the first snapshot restore. Record the execution time, target identity, commands used, key output, verdict, and next action together in the result.

  5. Re-verify recovery of K3s and cluster build-out

    If a join fails, preserve the hostname, route, time, and certificate logs before reissuing a token. If there is a datastore quorum problem, do not add new servers arbitrarily; go back to the official restore procedure. After recovery, measure again with the same commands and the same success criteria. Do not close an incident just because things appear normal.

Conceptual explanation 01

Approve a K3s bootstrap based on the prerequisites and the datastore evidence

Quorum: the majority participation condition a distributed datastore needs in order to make consistent decisions.

K3s is more than a binary that simply deploys Kubernetes components; it bundles the lifecycle of the datastore, server token, embedded networking, and packaged components. The first server and any additional servers or agents differ in role and in recovery responsibility.

A server node holds the API and the control-plane and datastore roles, while an agent runs workloads. The token is the credential for joining a node; if it leaks, any node can enter the trust boundary.

Before running an installation script, pre-check the hostname, time, network, ports, disks, cgroups, and topology. Keep the install command and the configuration file revision as evidence.

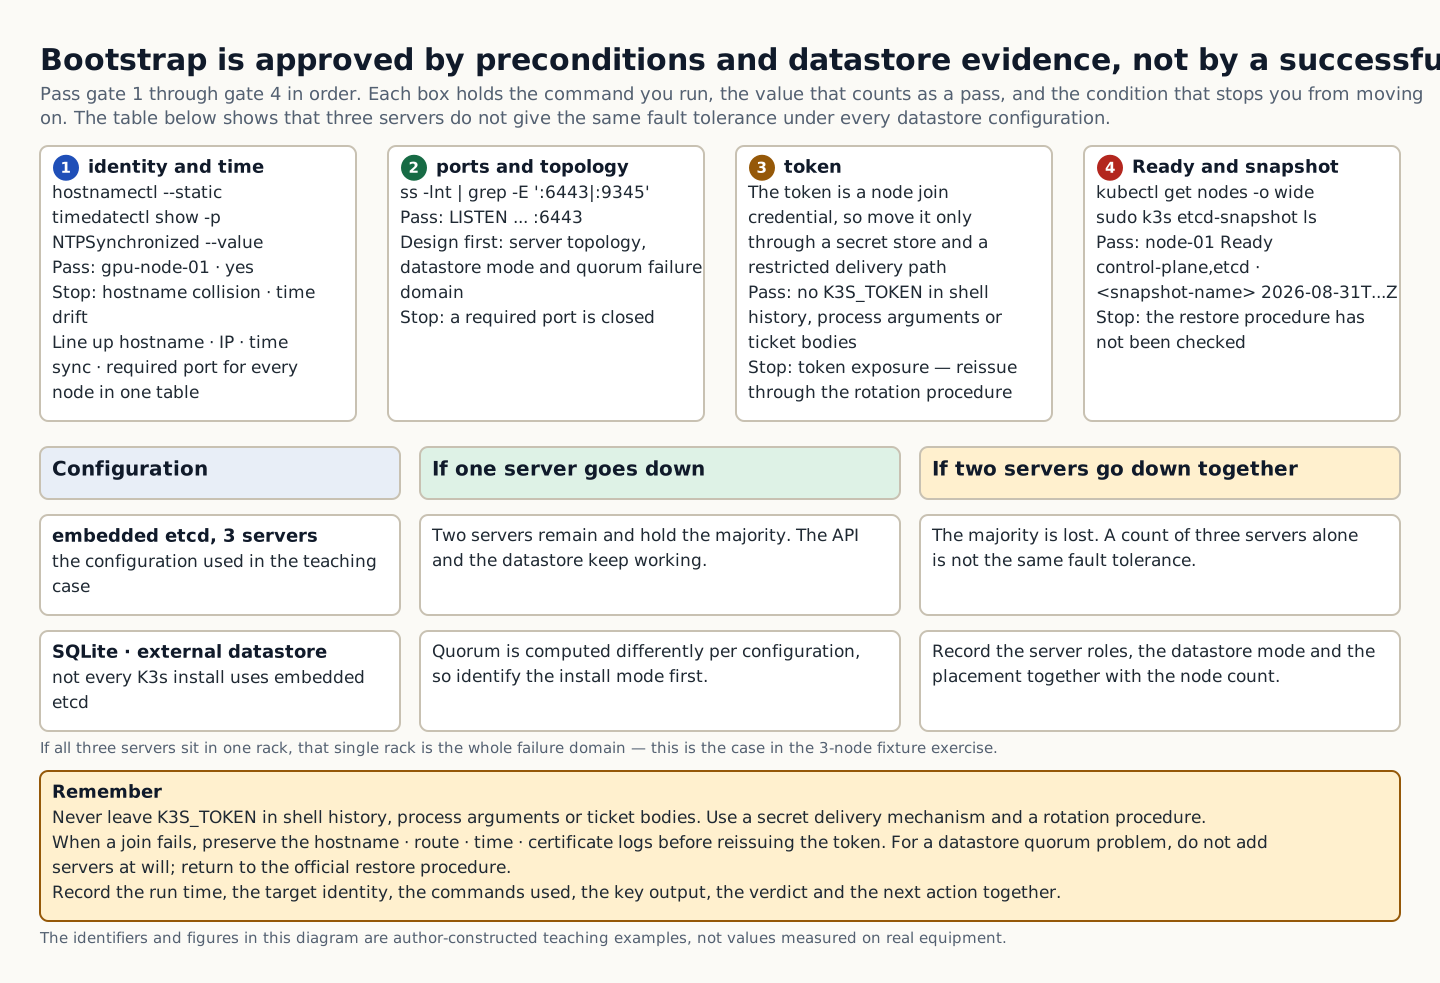
In the training example, if one of three embedded etcd servers goes down, two remain. If two go down at once you lose the majority, so this is not the same fault tolerance. Record the server roles, the datastore mode and the placement along with the node count. Not every K3s installation uses embedded etcd, so first distinguish a SQLite or external datastore configuration.

The check commands and pass values of four gates (identity and time, ports and topology, token, and Ready and snapshot), with a quorum comparison table by datastore configuration
How to read the figure Read gate 1 through gate 4 from left to right. Each gate box lists, in order, the check command, the value that counts as a pass, and the stop condition that keeps you from moving on. Bootstrap is approved only after all four gates are passed; the fact that the install script finished is not an approval on its own. The table below compares how one server going down and two servers going down together turn out differently for the same three servers, depending on whether the datastore is embedded etcd or SQLite / an external datastore. When two go down together the majority is lost, so the number of servers alone does not describe fault tolerance. The line under the table means that if all three servers sit in one rack, that single rack is the whole failure domain. The last box covers token handling, the logs to preserve when a join fails, and the items to record in the result. The identifiers, figures and states in the diagram are author-constructed teaching examples, not values measured on real equipment. Source: composed by the author based on K3s Architecture · K3s Backup and Restore · K3s Requirements.
Why does this happen?
A server node takes the API and control-plane/datastore roles, while an agent runs workloads. The token is the credential for joining a node, and if it is exposed, an arbitrary node can enter the trust boundary.
When is it a problem?
If you see a hostname collision, time drift, or token exposure, there are insufficient grounds to proceed.
Common beginner misconceptions
Do not leave K3S_TOKEN in shell history, process arguments, or ticket bodies. Use a secret delivery mechanism and a rotation procedure.
How to verify it yourself
Build a table of the hostname, IP, time sync, and required ports for every node. Design the server topology, datastore mode, and quorum failure domain.
To summarize this sectionYou succeed when you submit the per-node pre-check sheet, the role and failure-domain map, the secret handling, and the plan for confirming the first snapshot restore.

CHAPTER 1 / 5

Start the checks from the prerequisites

Do not guess the cause and start by changing settings. If you group the following evidence into records from the same time window, another operator can reproduce the boundary at which the expected state broke.

1. Reconcile the hostname, IP, time sync, and required ports of every node in one table. 2. Design the server topology, datastore mode, and quorum failure domain. 3. Manage tokens in a secret store and through restricted delivery paths. 4. Check node Ready, component health, the datastore snapshot and the restore procedure.

CHAPTER 2 / 5

Fix the lab target for the first server

Commands for reproducing the isolated environment · do not run them in the browser
hostnamectl --static
timedatectl show -p NTPSynchronized --value
ss -lnt | grep -E ':6443|:9345' || true
kubectl get nodes -o wide
sudo k3s etcd-snapshot ls

CHAPTER 3 / 5

Distinguishes node join output from its meaning

Expected output for training · not an actual measurement
gpu-node-01
yes
LISTEN ... :6443
node-01 Ready control-plane,etcd ...
<snapshot-name> 2026-08-31T...Z

CHAPTER 4 / 5

Make the go/stop decision on the bootstrap evidence

CHAPTER 5 / 5

Re-verify recovery of K3s and cluster build-out

CONCRETE CASES

In the bootstrap plan for the 3-node fixture, find the duplicate hostname and the server quorum concentrated in a single rack.

Before running an installation script, pre-check the hostname, time, network, ports, disks, cgroups, and topology. Keep the install command and the configuration file revision as evidence.

Wrong responses and boundaries to check

Do not leave K3S_TOKEN in shell history, process arguments, or ticket bodies. Use a proper secret delivery mechanism and a rotation procedure.

If a join fails, preserve the hostname, route, time, and certificate logs before reissuing a token. If there is a datastore quorum problem, do not add new servers arbitrarily; go back to the official restore procedure. After recovery, measure again with the same commands and the same success criteria. Do not close an incident just because things appear normal.

INTERACTIVE LAB 1 / 2

Lab 1 · Find the basis for a verdict in the output

Enter values in the browser and check the execution results and the failure and recovery paths. No commands are ever sent to real equipment or the NAS.

Lab scenario:: In the bootstrap plan for the 3-node fixture, find the duplicate hostname and the problem of server quorum nodes concentrated in a single rack. Instructions:: In the browser, read the training output below and write a verdict. Do not send the commands to real equipment. To reproduce the commands separately, prepare an approved isolated environment with the relevant tools and example files. Save the entire output, and if you see a hostname collision, time drift, or token exposure, do not move on to the next change.

gpu-node-01
yes
LISTEN ... :6443
node-01 Ready control-plane,etcd ...
<snapshot-name> 2026-08-31T...Z

The point is not to memorize the values themselves but to confirm that identity, time, the API port, node conditions, and the datastore snapshot match the design. The values shown are reproduced examples for training, not measurements taken on real equipment. Identifiers and values can differ by device, driver, and cluster.

INTERACTIVE LAB 2 / 2

Lab 2 · Plan for stopping and recovery

Enter values in the browser and check the execution results and the failure and recovery paths. No commands are ever sent to real equipment or the NAS.

Do not leave K3S_TOKEN in shell history, process arguments, or ticket bodies. Use a proper secret delivery mechanism and a rotation procedure.

KEY TERMS

Key terms in this unit

Quorum
The majority participation required for a distributed datastore to make consistent decisions.

UNIT WORKBOOK

Exercises and worksheets for applying concepts to new situations

Start by checking basic principles, then expand to practical workplace decisions. After submitting an answer, you can see why every option is correct or incorrect, not just the correct answer.

Write the stop conditions and recovery evidence for K3s and cluster build-out into a work record.

PERSONAL WORKSHEET

A learning worksheet you adapt to your own environment

Your input remains only on the current browser screen and is not stored or transmitted externally. Use categories and pseudonyms instead of actual sensitive information.

OFFICIAL SOURCES

Verify against official sources

Reviewed against official documentation and training output. Commands and performance tests on real hardware are unconfirmed.

CORE UNIT 3 / 4

Workload·service·network

Verify the request path across Pod, Deployment, Service, and Ingress.

Difficulty
Intermediate
Structure
Lessons 5 · Labs 2 · Assessment

Diagrams and tables: composed by the author using each lesson's official primary sources. Find the originals and review dates at the end of that lesson.

PREREQUISITE CHECK

Three things to check before reading

This is not a test of memorized answers. Think about each question first, then open the explanation to review the foundational concepts used in this course.

1Does this unit send commands to real equipment?

No. Read the training output in the browser and make the judgment there. Any separate reproduction is done only in an approved isolated environment.

2What permissions and environment must you confirm before the lab?

Dedicated lab cluster-admin · no production credentials. Isolated cluster CIDR, service CIDR, and documentation-only ingress address.

3What evidence did you record in the previous unit, "K3s and cluster build-out"?

Success means submitting a per-node pre-check list, a role and failure-domain map, secret handling, and a plan for confirming the first snapshot restore.

TEXTBOOK GUIDE

Main text that covers each concept from its background to the criteria for judging it

We explain the material section by section so readers new to IT can connect causes and effects without memorizing terms.

  1. Explain the components and failure boundaries of Workload, service, and network with a diagram.
  2. Judge the state of Workload, service, and network from command output and observed values.
  3. Write the stop conditions and recovery evidence for Workload, service, and network into a work record.
Workload·service·network Lab environment and safety boundaries
Hardware3-node VM fixture · no load balancer
SoftwareUbuntu 24.04·K3s v1.31.x fixture·kubectl
Required permissionsDedicated lab cluster-admin · no production credentials
NetworkingIsolated cluster CIDR · service CIDR · documentation ingress address

Reviewed against official documentation and training output. Commands and performance tests on real hardware are unconfirmed.

Applies to version: Kubernetes 1.31 API fixture · K3s v1.31.x+k3s1 fixture · Manuscript review date: 2026-09-01

CONCEPT FLOW

How the chapters connect

The chapters are not isolated short answers to memorize. Follow them from left to right to see how each chapter's concepts support the next decision.

  1. 1.Start the check at the Pod process
  2. 2.Pins down the lab target for the EndpointSlice
  3. 3.Distinguishes Service output from its meaning
  4. 4.Decides whether the Ingress proceeds or stops
  5. 5.Re-verify recovery of Workload, service, and network
Workload·service·network: the overall map. If you lose track while reading the detailed explanations and chapters below, return to this sequence.

CONTROLLED EXPLANATION

Follow the evidence to check, one step at a time

Current explanation · 1/5 · Start the check at the Pod process

Up next: Pins down the lab target for the EndpointSlice

  1. Start the check at the Pod process

    Do not guess the cause and start by changing settings. If you group the following evidence into records from the same time window, another operator can reproduce the boundary at which the expected state broke.

  2. Pins down the lab target for the EndpointSlice

    Lab scenario:: Find the label selector typo in a fixture where the Deployment is Available but the Service endpoint is empty. Instructions:: In the browser, read the training output below and write a verdict. Do not send the commands to real equipment. To reproduce the commands separately, prepare an approved isolated environment with the relevant tools and example files. Save the entire output, and if the selector, port, or readiness does not match, do not move on to the next change.

  3. Distinguishes Service output from its meaning

    The point is not to memorize the values themselves but to confirm the exact reason why the Pod readiness state and the Service selector failed to produce the same endpoint. The values shown are reproduced examples for training, not measurements taken on real equipment. Identifiers and values can differ by device, driver, and cluster.

  4. Decides whether the Ingress proceeds or stops

    The task is complete when you tabulate the identity, port, and condition of the four hops, fix the one mismatch, and re-verify through to an external request. Record the execution time, target identity, commands used, key output, verdict, and next action together in the result.

  5. Re-verify recovery of Workload, service, and network

    Preserve the current manifest and events, then fix the selector or the probe in the Git source. Check the rollout status, the EndpointSlice registration, and internal and external requests on the same revision. After recovery, measure again with the same commands and the same success criteria. Do not close an incident just because things appear normal.

Conceptual explanation 01

Verify the request path from Pod readiness to the external Ingress

Readiness: the signal that tells whether a workload is ready to accept new requests.

The Pod IP, the Service virtual IP, the EndpointSlice, the Ingress/Gateway, and the external load balancer are all different hops. If Pod Ready and Service endpoint registration disagree, users see failures even though the process is alive.

Readiness checks whether new traffic can be accepted, liveness checks whether a restart is needed for recovery, and startup checks whether initialization has completed. When a startup probe is configured, readiness and liveness probes wait until it succeeds. Using the same endpoint is not inherently an error, but verify that each signal's success criteria and failure behavior represent the actual requirements.

When you receive a report that something does not work from outside, do not start by blindly tracing DNS. Test Pod localhost, the Pod IP, the Service/EndpointSlice, the Ingress route, and the external path one step at a time.

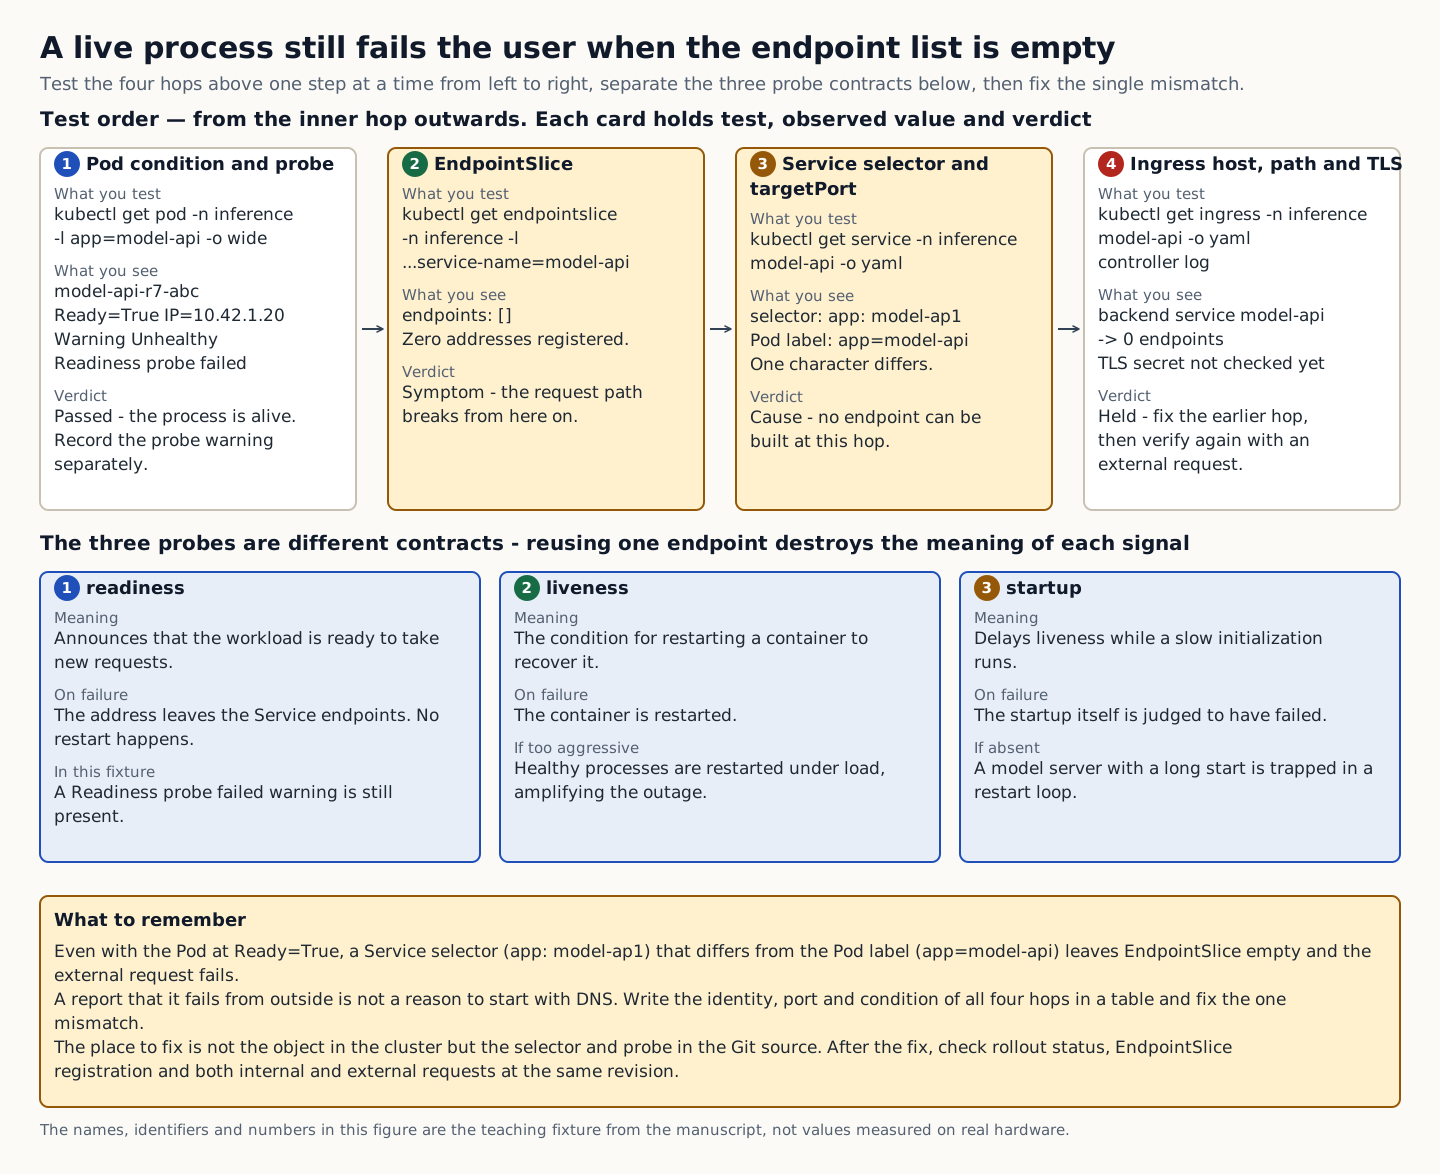
In the training example, the Pod is Running, but its readiness check failed, so it was not included among the Service's healthy endpoints. Changing external DNS first just because the process is running misses the failing layer. Compare the Pod readiness state, the Service selector, and the EndpointSlice first, then move up to the ingress. Using liveness in place of readiness can cause unnecessary restarts during a temporary delay in an external dependency.

A figure that links four hops (Pod condition and probe, EndpointSlice, Service selector and targetPort, and Ingress) by test command, observed value, and verdict, and distinguishes the contracts of the readiness, liveness, and startup probes
How to read the figure Read the four boxes at the top from left to right, that is, from the innermost hop outward. Each box has three cells: the test command, the observed value, and the verdict. Hop 1, the Pod, passes with Ready=True · IP 10.42.1.20, and the Readiness probe failed warning is noted separately. endpoints: [] in hop 2, the EndpointSlice, is the visible symptom, and the one-character difference between the selector app: model-ap1 of the Service in hop 3 and the Pod label app=model-api is the cause. Hop 4, the Ingress, has its verdict held until the earlier hop is fixed, and is then checked again with an external request. The three boxes below distinguish what readiness · liveness · startup mean and what happens when each fails; using the same endpoint is not an error in itself, but when the need to restart, the ability to accept traffic, and startup completion differ, validate each probe's success conditions and failure behavior separately. Boxes with a different fill color only mark the hops where the symptom and the cause are, and the same content can be read from the verdict text without distinguishing colors. The last box records that the place to fix is not the object in the cluster but the selector and probe in the Git source, and that after the fix you recheck rollout status · EndpointSlice registration · internal and external requests at the same revision. The names · identifiers · numbers in the figure are a training fixture, not values measured on real equipment. Source: composed by the author based on Kubernetes Liveness, Readiness and Startup Probes · Kubernetes Services, Load Balancing, and Networking.
Why does this happen?
Even when a temporary failure of an external dependency means the service must stop accepting traffic, restarting the process may not help. Distinguishing readiness from the need to restart avoids unnecessary restarts.
When is it a problem?
If you see a selector, port, or readiness mismatch, there are insufficient grounds to proceed.
Common beginner misconceptions
An overly aggressive liveness setting repeatedly restarts healthy processes under overload and amplifies the incident. Design what startup and readiness mean first.
How to verify it yourself
Check the Pod conditions and the probe failure reasons. Look at the address, port, and ready condition in the EndpointSlice.
To summarize this sectionYou succeed when you tabulate the identity, port, and condition of the four hops, fix the single mismatch, and re-verify all the way out to the external request.

CHAPTER 1 / 5

Start the check at the Pod process

Do not guess the cause and start by changing settings. If you group the following evidence into records from the same time window, another operator can reproduce the boundary at which the expected state broke.

1. Check the Pod condition and the probe failure reason. 2. Check the address, port, and ready condition of the EndpointSlice. 3. Compare the Service selector and targetPort with the actual Pod label and listen port. 4. Link the Ingress host, path, backend, and TLS secret to the controller log.

CHAPTER 2 / 5

Pins down the lab target for the EndpointSlice

Commands for reproducing the isolated environment · do not run them in the browser
kubectl get pod -n inference -l app=model-api -o wide
kubectl get endpointslice -n inference -l kubernetes.io/service-name=model-api -o yaml
kubectl get service,ingress -n inference model-api -o yaml
kubectl describe pod -n inference -l app=model-api

CHAPTER 3 / 5

Distinguishes Service output from its meaning

Expected output for training · not an actual measurement
Pod model-api-r7-abc Ready=True IP=10.42.1.20
endpoints: []
selector: app: model-ap1
Warning Unhealthy Readiness probe failed ...

CHAPTER 4 / 5

Decides whether the Ingress proceeds or stops

CHAPTER 5 / 5

Re-verify recovery of Workload, service, and network

CONCRETE CASES

In a fixture where the Deployment is Available but the Service endpoints are empty, find the typo in the label selector.

When you receive a report that something does not work from outside, do not start by blindly tracing DNS. Test Pod localhost, the Pod IP, the Service/EndpointSlice, the Ingress route, and the external path one step at a time.

Wrong responses and boundaries to check

Setting liveness too aggressively restarts healthy processes repeatedly under overload and amplifies the outage. Design the meaning of startup and readiness first.

Preserve the current manifest and events, then fix the selector or the probe in the Git source. Check the rollout status, the EndpointSlice registration, and internal and external requests on the same revision. After recovery, measure again with the same commands and the same success criteria. Do not close an incident just because things appear normal.

INTERACTIVE LAB 1 / 2

Lab 1 · Find the basis for a verdict in the output

Enter values in the browser and check the execution results and the failure and recovery paths. No commands are ever sent to real equipment or the NAS.

Lab scenario:: Find the label selector typo in a fixture where the Deployment is Available but the Service endpoint is empty. Instructions:: In the browser, read the training output below and write a verdict. Do not send the commands to real equipment. To reproduce the commands separately, prepare an approved isolated environment with the relevant tools and example files. Save the entire output, and if the selector, port, or readiness does not match, do not move on to the next change.

Pod model-api-r7-abc Ready=True IP=10.42.1.20
endpoints: []
selector: app: model-ap1
Warning Unhealthy Readiness probe failed ...

The point is not to memorize the values themselves but to confirm the exact reason why the Pod readiness state and the Service selector failed to produce the same endpoint. The values shown are reproduced examples for training, not measurements taken on real equipment. Identifiers and values can differ by device, driver, and cluster.

INTERACTIVE LAB 2 / 2

Lab 2 · Plan for stopping and recovery

Enter values in the browser and check the execution results and the failure and recovery paths. No commands are ever sent to real equipment or the NAS.

Setting liveness too aggressively restarts healthy processes repeatedly under overload and amplifies the outage. Design the meaning of startup and readiness first.

KEY TERMS

Key terms in this unit

Readiness
The signal that tells whether a workload is ready to accept new requests.

UNIT WORKBOOK

Exercises and worksheets for applying concepts to new situations

Start by checking basic principles, then expand to practical workplace decisions. After submitting an answer, you can see why every option is correct or incorrect, not just the correct answer.

Write the stop conditions and recovery evidence for Workload, service, and network into a work record.

PERSONAL WORKSHEET

A learning worksheet you adapt to your own environment

Your input remains only on the current browser screen and is not stored or transmitted externally. Use categories and pseudonyms instead of actual sensitive information.

OFFICIAL SOURCES

Verify against official sources

Reviewed against official documentation and training output. Commands and performance tests on real hardware are unconfirmed.

CORE UNIT 4 / 4

Storage and cluster operations

Connect the PV, CSI, upgrade, backup, and node failure boundaries.

Difficulty
Intermediate
Structure
Lessons 5 · Labs 2 · Assessment

Diagrams and tables: composed by the author using each lesson's official primary sources. Find the originals and review dates at the end of that lesson.

PREREQUISITE CHECK

Three things to check before reading

This is not a test of memorized answers. Think about each question first, then open the explanation to review the foundational concepts used in this course.

1Does this unit send commands to real equipment?

No. Read the training output in the browser and make the judgment there. Any separate reproduction is done only in an approved isolated environment.

2What permissions and environment must you confirm before the lab?

Dedicated lab cluster-admin · no production credentials. Isolated cluster CIDR, service CIDR, and documentation-only ingress address.

3What evidence did you record in the previous unit, "Workloads, services, and networking"?

The task is complete when you tabulate the identity, port, and condition of the four hops, fix the one mismatch, and re-verify through to an external request.

TEXTBOOK GUIDE

Main text that covers each concept from its background to the criteria for judging it

We explain the material section by section so readers new to IT can connect causes and effects without memorizing terms.

  1. Explain the components and failure boundaries of Storage and cluster operations with a diagram.
  2. Judge the state of Storage and cluster operations from command output and observed values.
  3. Write the stop conditions and recovery evidence for Storage and cluster operations into a work record.
Storage and cluster operations Lab environment and safety boundaries
Hardware3-node VM fixture · no load balancer
SoftwareUbuntu 24.04·K3s v1.31.x fixture·kubectl
Required permissionsDedicated lab cluster-admin · no production credentials
NetworkingIsolated cluster CIDR · service CIDR · documentation ingress address

Reviewed against official documentation and training output. Commands and performance tests on real hardware are unconfirmed.

Applies to version: Kubernetes 1.31 API fixture · K3s v1.31.x+k3s1 fixture · Manuscript review date: 2026-09-01

CONCEPT FLOW

How the chapters connect

The chapters are not isolated short answers to memorize. Follow them from left to right to see how each chapter's concepts support the next decision.

  1. 1.Start the check at the PVC contract
  2. 2.Pins down the lab target for the CSI path
  3. 3.Distinguishes node operations output from its meaning
  4. 4.Decide whether to proceed or stop at the recovery test
  5. 5.Re-verify recovery of Storage and cluster operations
Storage and cluster operations: the overall map. If you lose track while reading the detailed explanations and chapters below, return to this sequence.

CONTROLLED EXPLANATION

Follow the evidence to check, one step at a time

Current explanation · 1/5 · Start the check at the PVC contract

Up next: Pins down the lab target for the CSI path

  1. Start the check at the PVC contract

    Do not guess the cause and start by changing settings. If you group the following evidence into records from the same time window, another operator can reproduce the boundary at which the expected state broke.

  2. Pins down the lab target for the CSI path

    Lab scenario:: Fix a fixture in which a model artifact PVC that needs Retain uses the Delete policy, and revise the upgrade drain plan. Instructions:: In the browser, read the training output below and write a verdict. Do not send the commands to real equipment. To reproduce the commands separately, prepare an approved isolated environment with the relevant tools and example files. Save the entire output, and if the reclaim policy, snapshot, or PDB is unverified, do not move on to the next change.

  3. Distinguishes node operations output from its meaning

    The point is not to memorize the values themselves but to confirm that the volume lifetime, attachment, disruption, and datastore recovery contracts fit the maintenance plan. The values shown are reproduced examples for training, not measurements taken on real equipment. Identifiers and values can differ by device, driver, and cluster.

  4. Decide whether to proceed or stop at the recovery test

    Success means building the PVC → PV → CSI → node → backup dependency map and stating the canary upgrade and restore acceptance. Record the execution time, target identity, commands used, key output, verdict, and next action together in the result.

  5. Re-verify recovery of Storage and cluster operations

    On a mount failure, do not delete the Pod repeatedly; preserve the VolumeAttachment, the node plugin, and the backend volume identity. On an upgrade failure, stop the canary, roll back to a supported earlier revision, then verify the snapshot and the volume. After recovery, measure again with the same commands and the same success criteria. Do not close an incident just because things appear normal.

Conceptual explanation 01

Connect the lifecycle from the PVC through to datastore and volume recovery

PVC (PersistentVolumeClaim): a storage request in which a workload declares the capacity and access conditions it needs.

PersistentVolume (PV) and PersistentVolumeClaim (PVC) describe storage lifetime and binding contracts; actual provisioning, attachment, and mounting depend on the Container Storage Interface (CSI) driver and node conditions. The PV reclaim policy concerns volume handling after a claim is released, not Pod deletion itself. Check the Retain or Delete setting and CSI driver behavior, and distinguish Pod lifetime from PVC and PV lifetime.

A cluster upgrade involves the API, datastore, CNI, CSI, kubelet, and workload version skew. Even with a datastore snapshot, service recovery is incomplete if external volume data, secrets, and registry artifacts cannot be restored.

Before draining a node, check the PodDisruptionBudget, local volumes, daemon workloads, and GPU job checkpoints. Do not change all nodes at once; use a canary and stop criteria.

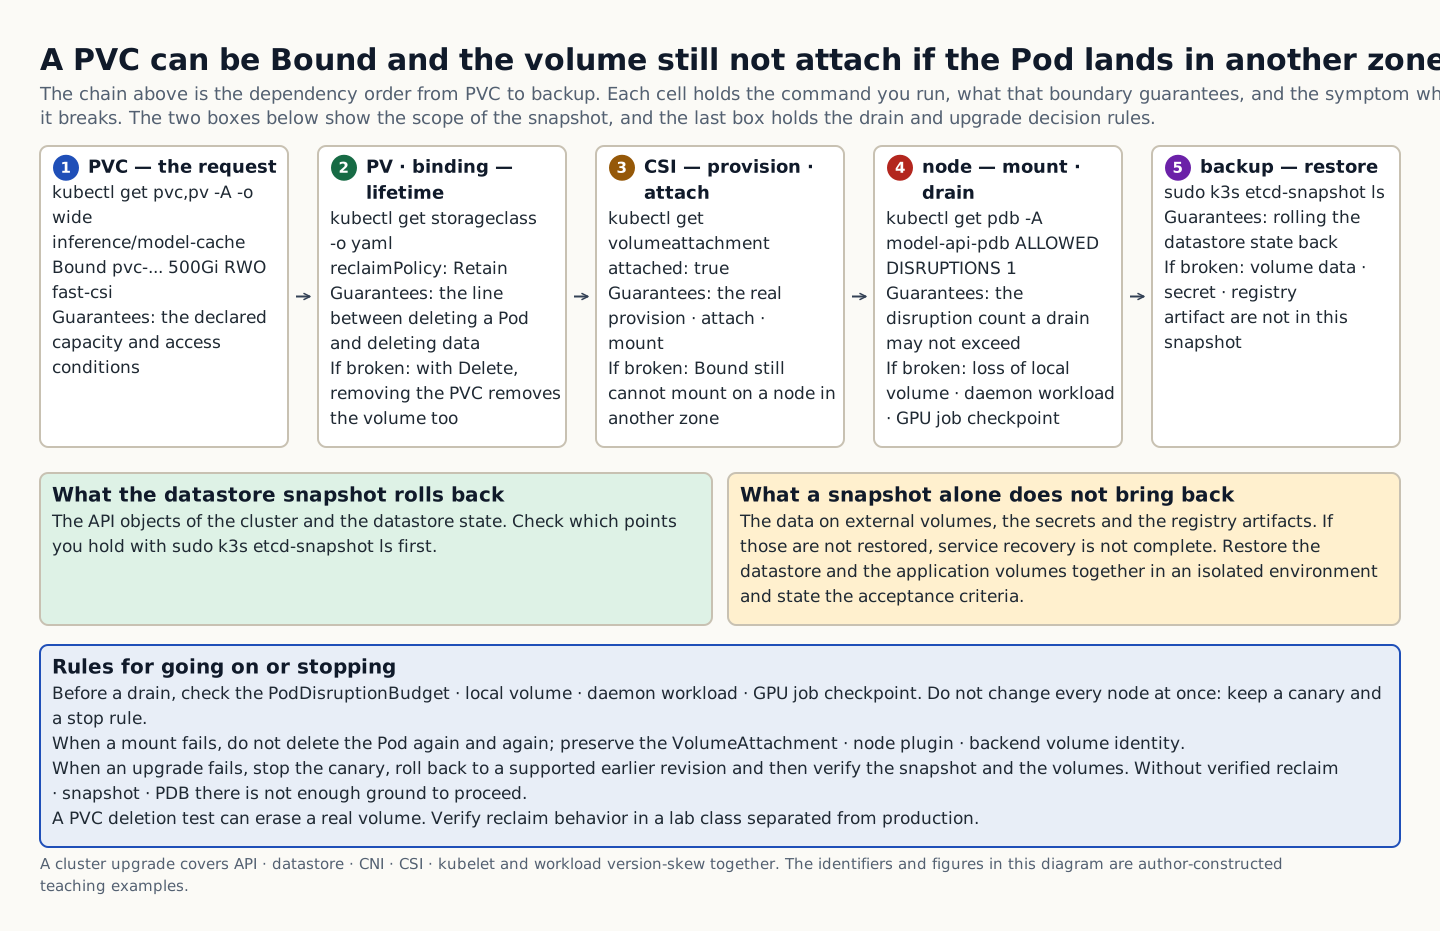
In the training example the PVC is Bound but the Pod was placed in a different zone and could not attach the volume. Bound means the claim and the volume are linked, not that it can be mounted on every node. Read the StorageClass binding mode, the volume topology and the Pod events together. Consider deleting a volume only after confirming the reclaim policy and the data recovery path.

The storage dependency chain from PVC through PV binding, CSI, and node to backup, with the recovery scope of snapshots and the drain and upgrade decision criteria
How to read the figure Read the chain at the top in order, from 1 PVC to 5 backup. Each cell contains the check command, what that boundary guarantees, and the symptom when it breaks. A PVC marked Bound means only that the request and the volume are linked, so, as in cell 3 (CSI), it may still fail to mount on a node in another zone. The two boxes below separate what a datastore snapshot restores from what a snapshot alone does not bring back. If the data, secrets, and registry artifacts of external volumes cannot be restored together, service recovery is not complete. The last box lists what to check before a drain, what to do when a mount or upgrade fails, and the limits of a PVC deletion test. If reclaim, snapshot, and PDB have not been verified, do not move on to the next change. The identifiers, numbers, and states in the figure are training examples composed by the author, not values measured on real equipment. Source: composed by the author based on Kubernetes Persistent Volumes · K3s Backup and Restore · Kubernetes Safely Drain a Node.
Why does this happen?
A cluster upgrade involves the API, datastore, CNI, CSI, kubelet, and workload version skew. Even with a datastore snapshot, service recovery is incomplete if external volume data, secrets, and registry artifacts cannot be restored.
When is it a problem?
If reclaim, snapshot, or PDB behavior is unverified, there are insufficient grounds to proceed.
Common beginner misconceptions
A PVC deletion test can erase a real volume. Verify reclaim behavior with a lab storage class that is separate from production.
How to verify it yourself
Check the PVC access mode, storage class, binding mode, and reclaim policy. Read the attach and mount boundaries from the VolumeAttachment and the CSI controller and node logs.
To summarize this sectionYou succeed when you build a PVC→PV→CSI→node→backup dependency map and state the canary upgrade and the restore acceptance explicitly.

CHAPTER 1 / 5

Start the check at the PVC contract

Do not guess the cause and start by changing settings. If you group the following evidence into records from the same time window, another operator can reproduce the boundary at which the expected state broke.

1. Check the PVC access mode, storage class, binding mode, and reclaim policy. 2. Read the attach/mount boundary from the VolumeAttachment and the CSI controller/node logs. 3. Assess the PDB, local data, checkpoints, and drain impact. 4. Restore the datastore and the application volumes together in an isolated environment.

CHAPTER 2 / 5

Pins down the lab target for the CSI path

Commands for reproducing the isolated environment · do not run them in the browser
kubectl get pvc,pv -A -o wide
kubectl get storageclass -o yaml
kubectl get volumeattachment
kubectl get pdb -A
sudo k3s etcd-snapshot ls

CHAPTER 3 / 5

Distinguishes node operations output from its meaning

Expected output for training · not an actual measurement
inference/model-cache Bound pvc-... 500Gi RWO fast-csi
reclaimPolicy: Retain
volumeattachment... attached: true
model-api-pdb ALLOWED DISRUPTIONS 1

CHAPTER 4 / 5

Decide whether to proceed or stop at the recovery test

CHAPTER 5 / 5

Re-verify recovery of Storage and cluster operations

CONCRETE CASES

Fix a fixture in which a model artifact PVC that needs Retain has a Delete policy, and fix the upgrade drain plan.

Before draining a node, check the PodDisruptionBudget, local volumes, daemon workloads, and GPU job checkpoints. Do not change all nodes at once; use a canary and stop criteria.

Wrong responses and boundaries to check

A PVC deletion test can erase a real volume. Verify reclaim behavior in a lab storage class kept separate from production.

On a mount failure, do not delete the Pod repeatedly; preserve the VolumeAttachment, the node plugin, and the backend volume identity. On an upgrade failure, stop the canary, roll back to a supported earlier revision, then verify the snapshot and the volume. After recovery, measure again with the same commands and the same success criteria. Do not close an incident just because things appear normal.

INTERACTIVE LAB 1 / 2

Lab 1 · Find the basis for a verdict in the output

Enter values in the browser and check the execution results and the failure and recovery paths. No commands are ever sent to real equipment or the NAS.

Lab scenario:: Fix a fixture in which a model artifact PVC that needs Retain uses the Delete policy, and revise the upgrade drain plan. Instructions:: In the browser, read the training output below and write a verdict. Do not send the commands to real equipment. To reproduce the commands separately, prepare an approved isolated environment with the relevant tools and example files. Save the entire output, and if the reclaim policy, snapshot, or PDB is unverified, do not move on to the next change.

inference/model-cache Bound pvc-... 500Gi RWO fast-csi
reclaimPolicy: Retain
volumeattachment... attached: true
model-api-pdb ALLOWED DISRUPTIONS 1

The point is not to memorize the values themselves but to confirm that the volume lifetime, attachment, disruption, and datastore recovery contracts fit the maintenance plan. The values shown are reproduced examples for training, not measurements taken on real equipment. Identifiers and values can differ by device, driver, and cluster.

INTERACTIVE LAB 2 / 2

Lab 2 · Plan for stopping and recovery

Enter values in the browser and check the execution results and the failure and recovery paths. No commands are ever sent to real equipment or the NAS.

A PVC deletion test can erase a real volume. Verify reclaim behavior in a lab storage class kept separate from production.

KEY TERMS

Key terms in this unit

PVC (PersistentVolumeClaim)
A storage request in which a workload declares the capacity and access conditions it needs.

UNIT WORKBOOK

Exercises and worksheets for applying concepts to new situations

Start by checking basic principles, then expand to practical workplace decisions. After submitting an answer, you can see why every option is correct or incorrect, not just the correct answer.

Write the stop conditions and recovery evidence for Storage and cluster operations into a work record.

PERSONAL WORKSHEET

A learning worksheet you adapt to your own environment

Your input remains only on the current browser screen and is not stored or transmitted externally. Use categories and pseudonyms instead of actual sensitive information.

OFFICIAL SOURCES

Verify against official sources

Reviewed against official documentation and training output. Commands and performance tests on real hardware are unconfirmed.

DECISION ACTIVITY

The Deployment is Available, but external requests return 503. What is the first diagnostic step?

First write down the evidence you need and the stop criteria, then choose a verdict.

Choose an answer

THREE-LEVEL ASSESSMENT

From basic principles to operational decisions

When you submit an answer you can see why every option is right or wrong.

Basic Question 1

What is the core role of a Kubernetes controller?

Choose an answer
Apply Question 2

What is the correct behavior when a readiness probe fails?

Choose an answer
Capstone Question 3

What is the most important recovery evidence before a cluster upgrade?

Choose an answer

LEARNING RECORD

Have you reviewed the text, decision activities, and all explanations?

Completion status is stored only in this browser.