KoreaDevKNOWLEDGE SHARING

Content typeLearn

AI INFRASTRUCTURE · 08 / 12

GPU platform

Learn how Kubernetes discovers and allocates GPUs, and the verification boundaries of GPU sharing, MIG, and distributed workloads.

Difficulty
Intermediate
Structure
Core units 3 · Judgment activities · Three-stage assessment

NEW HIRE ONBOARDING

Start in the order you would receive your first assignment

So that even a new hire with no prior IT background can follow along, we start with the situation, the task, the evidence, and when to report, before difficult definitions.

  1. 01

    Read the situation in one sentence

    Separate the responsibilities and failure boundaries from the driver through kubelet resources, scheduler placement, MIG/time-slicing, and multi-node collectives.

  2. 02

    Today's assignment

    Document the stop conditions and recovery evidence for distributed GPU workloads in a work record.

  3. 03

    Evidence that shows the work is complete

    Reviewed against official documentation and training output. Commands and performance tests on real hardware are unconfirmed.

  4. 04

    When to stop and ask a senior colleague

    A Pod is Pending while the GPU is visible on the node. What do you check first?

Unpack unfamiliar terms first

Device plugin
An extension component that advertises a node's devices to the kubelet and supplies device access information to containers.

Operational question for this course

How do you allocate GPU capacity by isolation, topology, and workload evidence rather than by a number?

Separate the responsibilities and failure boundaries from the driver through kubelet resources, scheduler placement, MIG/time-slicing, and multi-node collectives.

CORE UNIT 1 / 3

GPU discovery and scheduling

Separate the responsibilities of the driver, the device plugin, and the resource request.

Difficulty
Intermediate
Structure
Lessons 5 · Labs 2 · Assessment

Diagrams and tables: composed by the author using each lesson's official primary sources. Find the originals and review dates at the end of that lesson.

PREREQUISITE CHECK

Three things to check before reading

This is not a test of memorized answers. Think about each question first, then open the explanation to review the foundational concepts used in this course.

1Does this unit send commands to real equipment?

No. Read the training output in the browser and make the judgment there. Any separate reproduction is done only in an approved isolated environment.

2What permissions and environment must you confirm before the lab?

lab cluster-admin·GPU reconfiguration maintenance. cluster network·NCCL test fabric.

3How do you record a value you have never seen before and a test you have not yet run?

Record it as unconfirmed. Distinguish expected training output from actual measurements, and do not fill in blanks with unapproved work.

TEXTBOOK GUIDE

Main text that covers each concept from its background to the criteria for judging it

We explain the material section by section so readers new to IT can connect causes and effects without memorizing terms.

  1. Explain the components and failure boundaries of GPU discovery and scheduling with a diagram.
  2. Judge the state of GPU discovery and scheduling from command output and observed values.
  3. Write the stop conditions and recovery evidence for GPU discovery and scheduling into a work record.
GPU discovery and scheduling Lab environment and safety boundaries
Hardware2-node GPU cluster fixture·MIG-capable inventory
SoftwareKubernetes 1.31 fixture·NVIDIA device plugin·DCGM exporter
Required permissionslab cluster-admin·GPU reconfiguration maintenance
Networkingcluster network·NCCL test fabric

Reviewed against official documentation and training output. Commands and performance tests on real hardware are unconfirmed.

Applies to version: Kubernetes Device Plugin API stable v1beta1 · NVIDIA MIG Guide current documentation · Manuscript review date: 2026-09-01

CONCEPT FLOW

How the chapters connect

The chapters are not isolated short answers to memorize. Follow them from left to right to see how each chapter's concepts support the next decision.

  1. 1.Start the check at the host driver
  2. 2.Pins down the lab target for the device plugin
  3. 3.Distinguishes scheduler output from its meaning
  4. 4.Decides whether the runtime proceeds or stops
  5. 5.Re-verify recovery of GPU discovery and scheduling
GPU discovery and scheduling: the overall map. If you lose track while reading the detailed explanations and chapters below, return to this sequence.

CONTROLLED EXPLANATION

Follow the evidence to check, one step at a time

Current explanation · 1/5 · Start the check at the host driver

Up next: Pins down the lab target for the device plugin

  1. Start the check at the host driver

    Do not guess the cause and start by changing settings. If you group the following evidence into records from the same time window, another operator can reproduce the boundary at which the expected state broke.

  2. Pins down the lab target for the device plugin

    Lab scenario:: Classify a Pod stuck in Pending because of a resource name typo and a plugin crash fixture as separate failure domains. Instructions:: In the browser, read the training output below and write a verdict. Do not send the commands to real equipment. To reproduce the commands separately, prepare an approved isolated environment with the relevant tools and example files. Save the entire output, and if capacity, requests, and the runtime disagree, do not move on to the next change.

  3. Distinguishes scheduler output from its meaning

    The point is not to memorize the values themselves but to confirm that the resource is advertised and that placement is blocked by the current requests and allocations. The values shown are reproduced examples for training, not measurements taken on real equipment. Identifiers and values can differ by device, driver, and cluster.

  4. Decides whether the runtime proceeds or stops

    Success means linking the five boundaries host → plugin → node resource → Pod request → visible UUID with real identities. Record the execution time, target identity, commands used, key output, verdict, and next action together in the result.

  5. Re-verify recovery of GPU discovery and scheduling

    On a plugin failure, preserve the DaemonSet revision and logs and exclude the node from new GPU placement. After recovering to a supported combination, re-confirm allocatable and the UUID seen by a test Pod. After recovery, measure again with the same commands and the same success criteria. Do not close an incident just because things appear normal.

Conceptual explanation 01

Divide responsibilities from GPU discovery through device injection into the Pod

Device plugin: an extension component that advertises a node's devices to the kubelet and supplies device access information to containers.

Four steps are separate: the host driver discovers the GPU, the device plugin advertises the resource to the kubelet, the scheduler matches the Pod request, and the runtime injects the device node.

A vendor extended resource appears as an integer in capacity and allocatable and is generally not overcommitted. Labels, taints, and affinity narrow placement, but they do not automatically verify actual GPU health and topology.

Do not conclude from a Pending Pod that there is no GPU. Check nvidia-smi, the plugin DaemonSet, node allocatable, the Pod request, events, and runtime allocation in that order.

In the training example nvidia-smi shows 8 GPUs but the node allocatable contains no GPU. Host driver recognition and Kubernetes resource advertisement are separate boundaries. Check the device plugin state and the kubelet registration, then compare the resource requests with the actual Pod placement. Do not interpret a Pod without a request happening to reach a GPU as a scheduling guarantee.
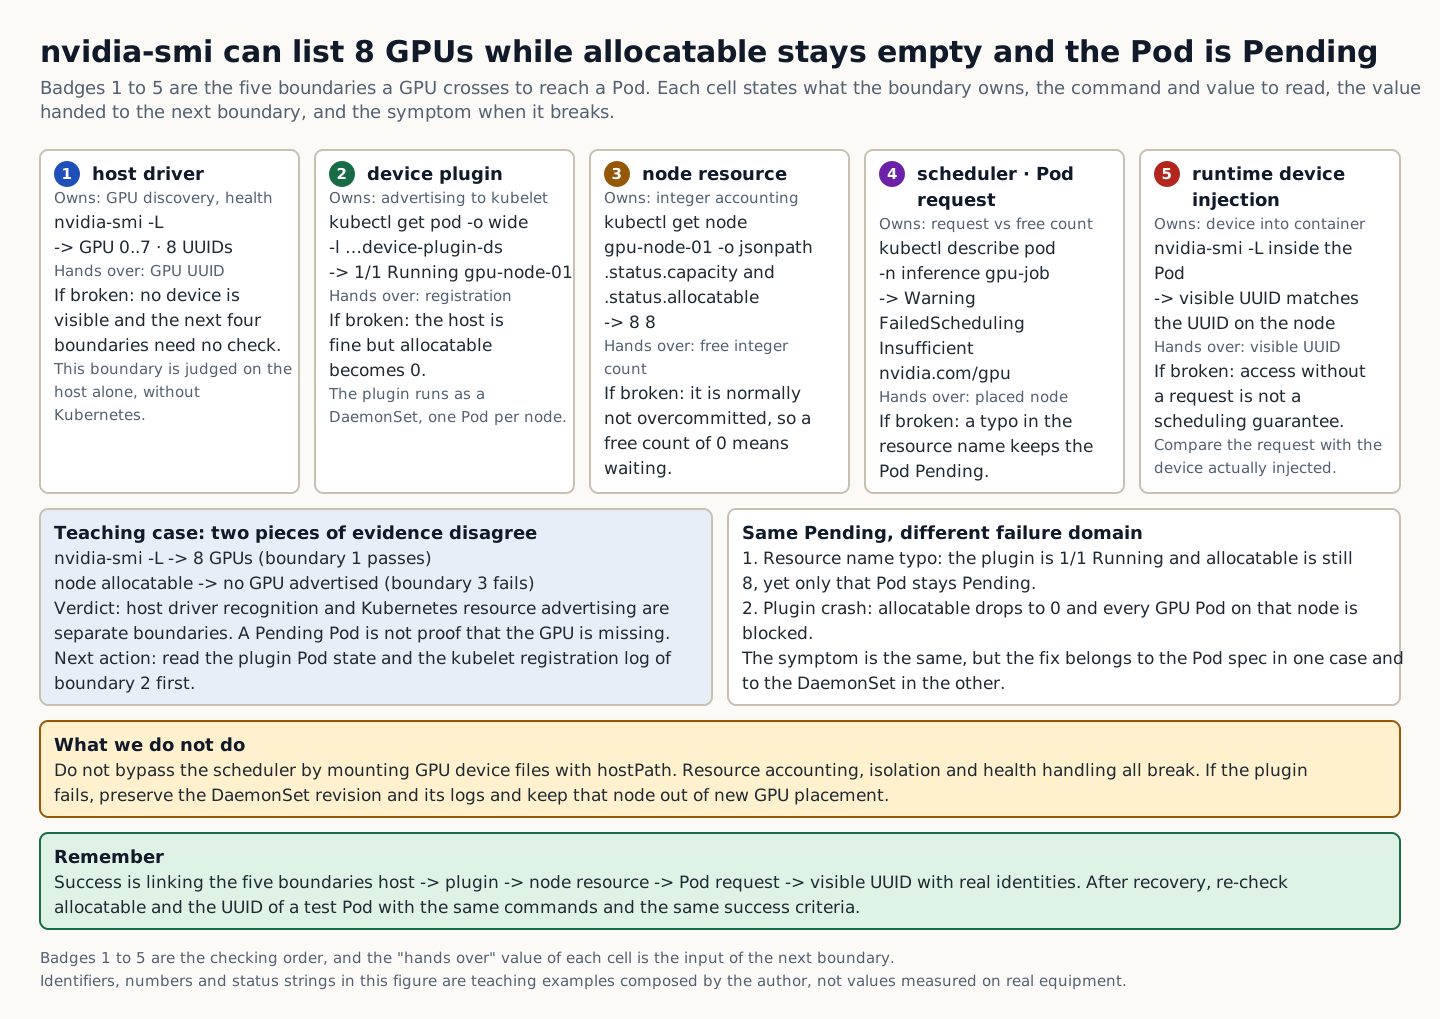
A figure that splits the five boundaries from the host driver to runtime device injection into what each owns, the command and value to check, the value handed to the next boundary, and the symptom when it breaks
How to read the figure Badges 1 to 5 are the five boundaries a GPU crosses to reach a Pod, and they are also the order in which to check. Each cell lists, in turn, what that boundary is responsible for, the command and value to read, the value passed to the next boundary, and the symptom when the chain breaks. The value one cell passes on is the input to the next cell, so the point where the value stops is the boundary to fix. The lower-left box is the training case in which nvidia-smi shows 8 GPUs but node allocatable advertises none; the right box shows that the same Pending status can come from a resource name typo or a plugin crash, which are different failure domains. The amber box prohibits bypassing the scheduler with hostPath, and the green box summarizes that success means linking all five boundaries with real identities. The judgment rule of this figure is not to conclude that there is no GPU just because a Pod is Pending. The figure does not depict physical cabling or time proportions; it shows only the check order and responsibility boundaries. Source: composed by the author based on Kubernetes Device Plugins · NVIDIA DCGM User Guide.
Why does this happen?
A vendor extended resource appears as an integer in capacity and allocatable and is generally not overcommitted. Labels, taints, and affinity narrow placement, but they do not automatically verify actual GPU health and topology.
When is it a problem?
If you see a capacity, request, or runtime mismatch, there are insufficient grounds to proceed.
Common beginner misconceptions
Do not bypass the scheduler by injecting GPU device files directly through hostPath. Doing so breaks resource accounting, isolation, and health handling.
How to verify it yourself
Check the host's GPU UUIDs and health first. Then check the device plugin Pod and the kubelet registration log.
To summarize this sectionYou succeed when you connect the five boundaries host→plugin→node resource→Pod request→visible UUID using real identities.

CHAPTER 1 / 5

Start the check at the host driver

Do not guess the cause and start by changing settings. If you group the following evidence into records from the same time window, another operator can reproduce the boundary at which the expected state broke.

1. Check the GPU UUID and health of the host first. 2. Check the device plugin Pod and the kubelet registration log. 3. Calculate node capacity/allocatable and the requests already allocated. 4. Correlate Pending events with the visible device UUIDs of the running Pods.
CHAPTER 2 / 5

Pins down the lab target for the device plugin

Commands for reproducing the isolated environment · do not run them in the browser
kubectl get node gpu-node-01 -o jsonpath='{.status.capacity.nvidia\.com/gpu}{" "}{.status.allocatable.nvidia\.com/gpu}{"\n"}'
kubectl get pod -A -l app.kubernetes.io/name=nvidia-device-plugin-ds -o wide
kubectl describe pod -n inference gpu-job

CHAPTER 3 / 5

Distinguishes scheduler output from its meaning

Expected output for training · not an actual measurement
8 8
nvidia-device-plugin-... 1/1 Running gpu-node-01
Warning FailedScheduling ... Insufficient nvidia.com/gpu

CHAPTER 4 / 5

Decides whether the runtime proceeds or stops

CHAPTER 5 / 5

Re-verify recovery of GPU discovery and scheduling

CONCRETE CASES

Classify a Pod that is Pending because of a resource name typo and a plugin crash fixture as separate failure domains.

Do not conclude from a Pending Pod that there is no GPU. Check nvidia-smi, the plugin DaemonSet, node allocatable, the Pod request, events, and runtime allocation in that order.

Wrong responses and boundaries to check

Do not bypass the scheduler by injecting GPU device files directly through hostPath. It breaks resource accounting, isolation, and health handling.

On a plugin failure, preserve the DaemonSet revision and logs and exclude the node from new GPU placement. After recovering to a supported combination, re-confirm allocatable and the UUID seen by a test Pod. After recovery, measure again with the same commands and the same success criteria. Do not close an incident just because things appear normal.

INTERACTIVE LAB 1 / 2

Lab 1 · Find the basis for a verdict in the output

Enter values in the browser and check the execution results and the failure and recovery paths. No commands are ever sent to real equipment or the NAS.

Lab scenario:: Classify a Pod stuck in Pending because of a resource name typo and a plugin crash fixture as separate failure domains. Instructions:: In the browser, read the training output below and write a verdict. Do not send the commands to real equipment. To reproduce the commands separately, prepare an approved isolated environment with the relevant tools and example files. Save the entire output, and if capacity, requests, and the runtime disagree, do not move on to the next change.

8 8
nvidia-device-plugin-... 1/1 Running gpu-node-01
Warning FailedScheduling ... Insufficient nvidia.com/gpu

The point is not to memorize the values themselves but to confirm that the resource is advertised and that placement is blocked by the current requests and allocations. The values shown are reproduced examples for training, not measurements taken on real equipment. Identifiers and values can differ by device, driver, and cluster.

INTERACTIVE LAB 2 / 2

Lab 2 · Plan for stopping and recovery

Enter values in the browser and check the execution results and the failure and recovery paths. No commands are ever sent to real equipment or the NAS.

Do not bypass the scheduler by injecting GPU device files directly through hostPath. It breaks resource accounting, isolation, and health handling.

KEY TERMS

Key terms in this unit

Device plugin
An extension component that advertises a node's devices to the kubelet and supplies device access information to containers.

UNIT WORKBOOK

Exercises and worksheets for applying concepts to new situations

Start by checking basic principles, then expand to practical workplace decisions. After submitting an answer, you can see why every option is correct or incorrect, not just the correct answer.

Write the stop conditions and recovery evidence for GPU discovery and scheduling into a work record.

PERSONAL WORKSHEET

A learning worksheet you adapt to your own environment

Your input remains only on the current browser screen and is not stored or transmitted externally. Use categories and pseudonyms instead of actual sensitive information.

OFFICIAL SOURCES

Verify against official sources

Reviewed against official documentation and training output. Commands and performance tests on real hardware are unconfirmed.

CORE UNIT 2 / 3

GPU isolation and sharing

Judge the trade-offs among exclusive GPU, time slicing, and MIG.

Difficulty
Intermediate
Structure
Lessons 5 · Labs 2 · Assessment

Diagrams and tables: composed by the author using each lesson's official primary sources. Find the originals and review dates at the end of that lesson.

PREREQUISITE CHECK

Three things to check before reading

This is not a test of memorized answers. Think about each question first, then open the explanation to review the foundational concepts used in this course.

1Does this unit send commands to real equipment?

No. Read the training output in the browser and make the judgment there. Any separate reproduction is done only in an approved isolated environment.

2What permissions and environment must you confirm before the lab?

lab cluster-admin·GPU reconfiguration maintenance. cluster network·NCCL test fabric.

3What evidence did you record in the previous unit, "GPU discovery and scheduling"?

Success means linking the five boundaries host → plugin → node resource → Pod request → visible UUID with real identities.

TEXTBOOK GUIDE

Main text that covers each concept from its background to the criteria for judging it

We explain the material section by section so readers new to IT can connect causes and effects without memorizing terms.

  1. Explain the components and failure boundaries of GPU isolation and sharing with a diagram.
  2. Judge the state of GPU isolation and sharing from command output and observed values.
  3. Write the stop conditions and recovery evidence for GPU isolation and sharing into a work record.
GPU isolation and sharing Lab environment and safety boundaries
Hardware2-node GPU cluster fixture·MIG-capable inventory
SoftwareKubernetes 1.31 fixture·NVIDIA device plugin·DCGM exporter
Required permissionslab cluster-admin·GPU reconfiguration maintenance
Networkingcluster network·NCCL test fabric

Reviewed against official documentation and training output. Commands and performance tests on real hardware are unconfirmed.

Applies to version: Kubernetes Device Plugin API stable v1beta1 · NVIDIA MIG Guide current documentation · Manuscript review date: 2026-09-01

CONCEPT FLOW

How the chapters connect

The chapters are not isolated short answers to memorize. Follow them from left to right to see how each chapter's concepts support the next decision.

  1. 1.Start the check at the workload requirements
  2. 2.Pins the lab target for the isolation choice
  3. 3.Distinguish the output of the sharing choice from its meaning
  4. 4.Make the go/stop decision on operational verification
  5. 5.Re-verify recovery of GPU isolation and sharing
GPU isolation and sharing: the overall map. If you lose track while reading the detailed explanations and chapters below, return to this sequence.

CONTROLLED EXPLANATION

Follow the evidence to check, one step at a time

Current explanation · 1/5 · Start the check at the workload requirements

Up next: Pins the lab target for the isolation choice

  1. Start the check at the workload requirements

    Do not guess the cause and start by changing settings. If you group the following evidence into records from the same time window, another operator can reproduce the boundary at which the expected state broke.

  2. Pins the lab target for the isolation choice

    Lab scenario:: Place a latency-sensitive inference and a batch embedding workload into three modes and write a selection table. Instructions:: In the browser, read the training output below and write a verdict. Do not send the commands to real equipment. To reproduce the commands separately, prepare an approved isolated environment with the relevant tools and example files. Save the entire output, and if the profile is insufficient, a tenant boundary is at issue, or the SLO is unverified, do not move on to the next change.

  3. Distinguish the output of the sharing choice from its meaning

    The point is not to memorize the values themselves but to confirm that the actual MIG profile and the cluster advertisement and quota reflect the sharing policy you chose. The values shown are reproduced examples for training, not measurements taken on real equipment. Identifiers and values can differ by device, driver, and cluster.

  4. Make the go/stop decision on operational verification

    The task is complete when you choose a mode for each of the two workloads based on its memory, SLO, and failure impact, and present the resources, quota, and observability metrics. Record the execution time, target identity, commands used, key output, verdict, and next action together in the result.

  5. Re-verify recovery of GPU isolation and sharing

    If the SLO is broken, preserve per-tenant telemetry and placement and stop new placements. Do not change the profile or mode immediately; reproduce the problem with the same workload on an isolated node, then make an approved change. After recovery, measure again with the same commands and the same success criteria. Do not close an incident just because things appear normal.

Conceptual explanation 01

Choose GPU isolation or sharing based on the SLO and the failure impact

MIG (Multi-Instance GPU, GPU hardware partitioning): a feature that divides a supported GPU into fixed compute and memory profiles; its support constraints must be checked.

An exclusive GPU gives a simple operating model and predictability, time-slicing gives higher average utilization, and Multi-Instance GPU (MIG) provides hardware partitions and independent resource profiles on supported GPUs. The three differ in performance, isolation, flexibility, and operational complexity.

Time-slicing workloads can contend for memory and compute resources on the same GPU, and one tenant's error can affect another workload. A MIG profile provides a fixed compute and memory slice, but the workload size and the P2P/NCCL constraints must be checked.

A sharing policy is not decided by utilization alone. Evaluate tenant trust, model memory, the latency SLO, bursts, preemption, telemetry, and reconfiguration maintenance together.

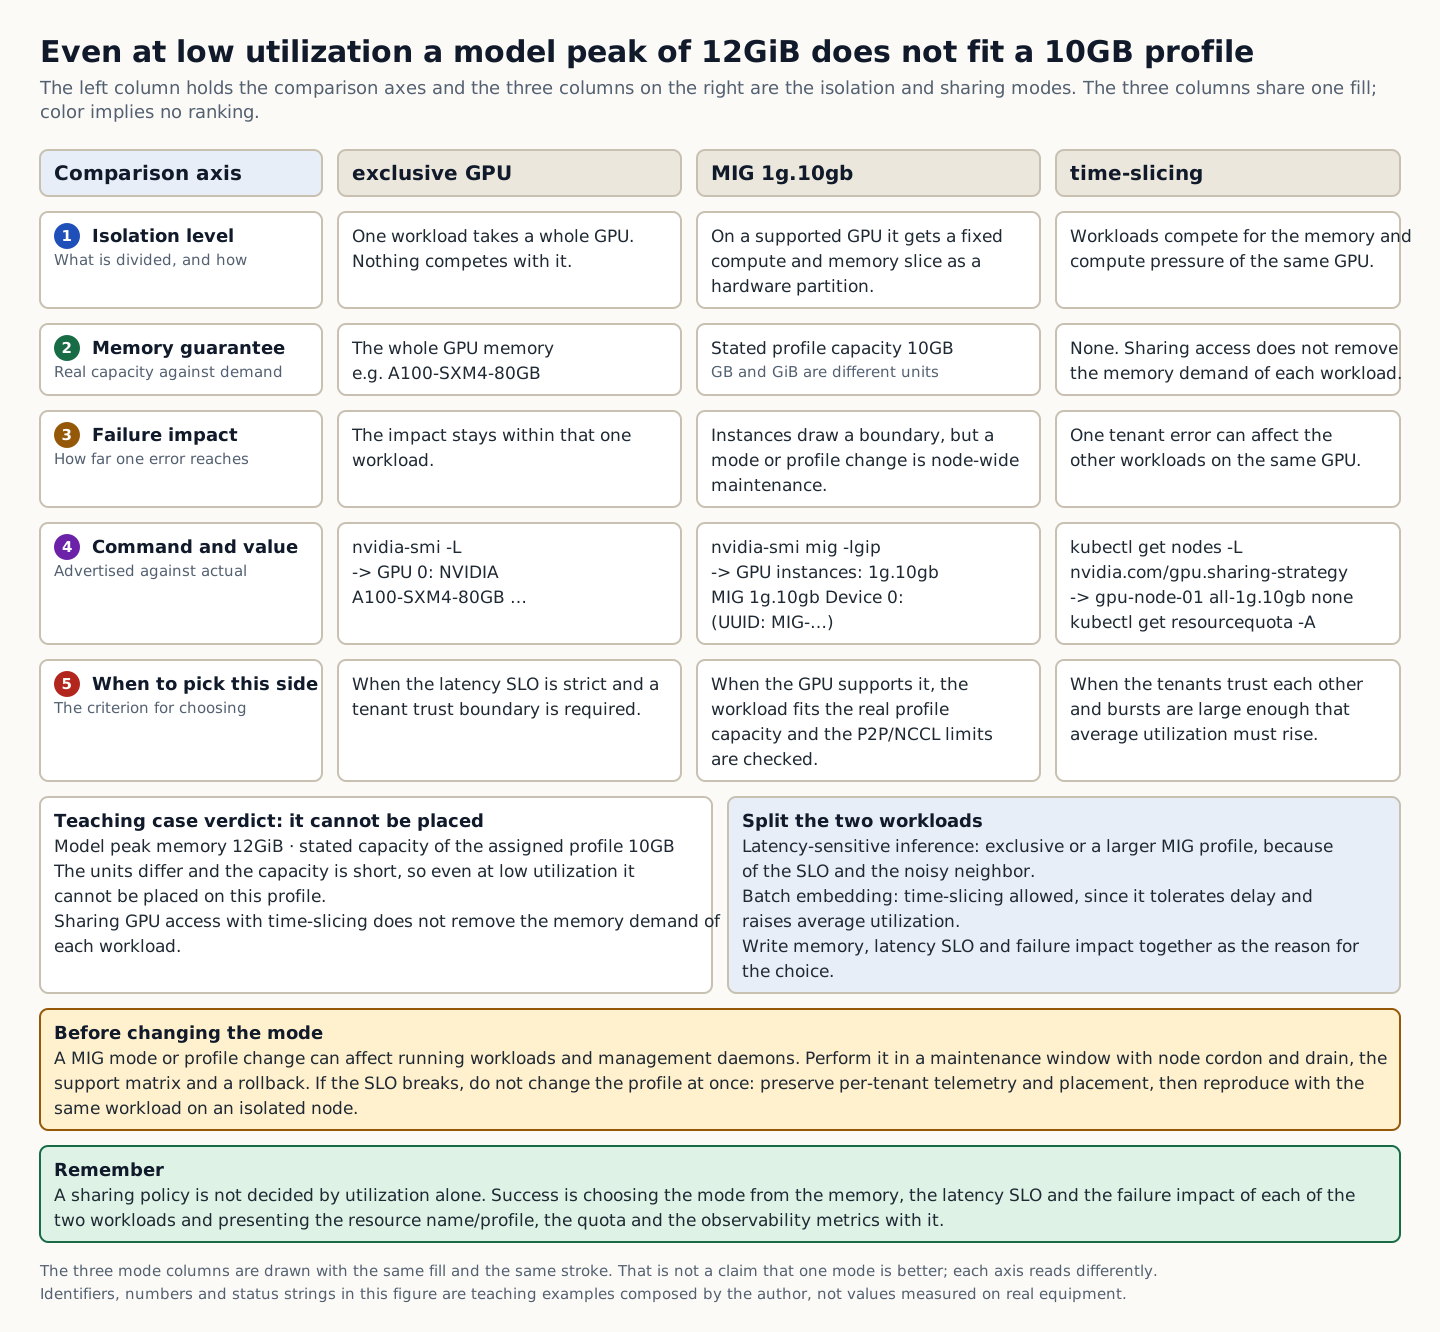
In the training example the peak memory the model needs is 12GiB while the labeled capacity of the allocation profile is 10GB. The units differ and the capacity is insufficient, so it cannot be placed even when utilization is low. Sharing GPU access with time slicing does not remove each workload's memory requirement. Verify the isolation level, the actual profile capacity and the latency under concurrent load together.

A table comparing exclusive GPU, MIG 1g.10gb, and time-slicing on five axes: isolation level, memory guarantee, failure impact, check command, and selection criterion
How to read the figure The left column lists the comparison axes, and the three columns on the right are exclusive GPU · MIG 1g.10gb · time-slicing. Reading each row across compares how the three modes differ on the same axis. The three columns are drawn with the same fill and line weight, and color does not indicate superiority. The memory guarantee row is the key point of this figure: a model peak of 12GiB does not fit in a profile with a labeled capacity of 10GB, so the model cannot be placed there even if utilization is low. The last row gives the criteria for deciding which mode to use when, and the two boxes below show the verdict for the training case and the result of placing the two workloads separately. The amber box means that MIG mode and profile changes should be made only during maintenance with cordon · drain and a rollback in place, and the green box summarizes that the mode should be chosen based on memory · SLO · failure impact. The figure is not a comparison of measured performance numbers but a table of selection criteria. Source: composed by the author based on NVIDIA Multi-Instance GPU User Guide · Kubernetes Device Plugins.
Why does this happen?
Time-sliced workloads can compete for memory and compute on the same GPU, and an error in one tenant can affect other workloads. A MIG profile provides fixed compute and memory slices, but you must check workload size and P2P/NCCL constraints.
When is it a problem?
If you see an insufficient profile, a tenant boundary issue, or an unverified SLO, there are insufficient grounds to proceed.
Common beginner misconceptions
Changing the MIG mode or profiles can affect running workloads and management daemons. Do it in a maintenance window with node cordon and drain, a support matrix, and a rollback plan.
How to verify it yourself
Measure the model's peak memory, compute duty cycle, and latency SLO. Write down the failure impact and noisy-neighbor risk for the exclusive, MIG, and time-slicing modes.
To summarize this sectionYou succeed when you choose a mode for each of the two workloads based on their memory, SLO, and failure impact, and present the resources, quotas, and observability metrics.

CHAPTER 1 / 5

Start the check at the workload requirements

Do not guess the cause and start by changing settings. If you group the following evidence into records from the same time window, another operator can reproduce the boundary at which the expected state broke.

1. Measure the model's peak memory, compute duty cycle, and latency SLO. 2. Write down the failure impact and noisy neighbor effects for exclusive, MIG, and time-slicing modes. 3. Check the resource name/profile, quota, and admission policy. 4. Correlate per-tenant utilization, memory, and errors with request latency.

CHAPTER 2 / 5

Pins the lab target for the isolation choice

Commands for reproducing the isolated environment · do not run them in the browser
nvidia-smi -L
nvidia-smi mig -lgip
kubectl get nodes -L nvidia.com/mig.config,nvidia.com/gpu.sharing-strategy
kubectl get resourcequota -A

CHAPTER 3 / 5

Distinguish the output of the sharing choice from its meaning

Expected output for training · not an actual measurement
GPU 0: NVIDIA A100-SXM4-80GB ...
  MIG 1g.10gb Device 0: (UUID: MIG-...)
GPU instances: 1g.10gb ...
gpu-node-01 all-1g.10gb none
inference gpu-quota ...

CHAPTER 4 / 5

Make the go/stop decision on operational verification

CHAPTER 5 / 5

Re-verify recovery of GPU isolation and sharing

CONCRETE CASES

Place a latency-sensitive inference workload and a batch embedding workload into the three modes and write a selection table.

A sharing policy is not decided by utilization alone. Evaluate tenant trust, model memory, the latency SLO, bursts, preemption, telemetry, and reconfiguration maintenance together.

Wrong responses and boundaries to check

Changing MIG mode or profiles can affect running workloads and management daemons. Do it during maintenance, with node cordon and drain, the support matrix, and a rollback ready.

If the SLO is broken, preserve per-tenant telemetry and placement and stop new placements. Do not change the profile or mode immediately; reproduce the problem with the same workload on an isolated node, then make an approved change. After recovery, measure again with the same commands and the same success criteria. Do not close an incident just because things appear normal.

INTERACTIVE LAB 1 / 2

Lab 1 · Find the basis for a verdict in the output

Enter values in the browser and check the execution results and the failure and recovery paths. No commands are ever sent to real equipment or the NAS.

Lab scenario:: Place a latency-sensitive inference and a batch embedding workload into three modes and write a selection table. Instructions:: In the browser, read the training output below and write a verdict. Do not send the commands to real equipment. To reproduce the commands separately, prepare an approved isolated environment with the relevant tools and example files. Save the entire output, and if the profile is insufficient, a tenant boundary is at issue, or the SLO is unverified, do not move on to the next change.

GPU 0: NVIDIA A100-SXM4-80GB ...
  MIG 1g.10gb Device 0: (UUID: MIG-...)
GPU instances: 1g.10gb ...
gpu-node-01 all-1g.10gb none
inference gpu-quota ...

The point is not to memorize the values themselves but to confirm that the actual MIG profile and the cluster advertisement and quota reflect the sharing policy you chose. The values shown are reproduced examples for training, not measurements taken on real equipment. Identifiers and values can differ by device, driver, and cluster.

INTERACTIVE LAB 2 / 2

Lab 2 · Plan for stopping and recovery

Enter values in the browser and check the execution results and the failure and recovery paths. No commands are ever sent to real equipment or the NAS.

Changing MIG mode or profiles can affect running workloads and management daemons. Do it during maintenance, with node cordon and drain, the support matrix, and a rollback ready.

KEY TERMS

Key terms in this unit

MIG (Multi-Instance GPU, GPU hardware partitioning)
A feature that partitions a supported GPU into fixed compute and memory profiles; its support constraints must be checked.

UNIT WORKBOOK

Exercises and worksheets for applying concepts to new situations

Start by checking basic principles, then expand to practical workplace decisions. After submitting an answer, you can see why every option is correct or incorrect, not just the correct answer.

Write the stop conditions and recovery evidence for GPU isolation and sharing into a work record.

PERSONAL WORKSHEET

A learning worksheet you adapt to your own environment

Your input remains only on the current browser screen and is not stored or transmitted externally. Use categories and pseudonyms instead of actual sensitive information.

OFFICIAL SOURCES

Verify against official sources

Reviewed against official documentation and training output. Commands and performance tests on real hardware are unconfirmed.

CORE UNIT 3 / 3

Distributed GPU workloads

Collect evidence on multi-node communication, placement, and failures.

Difficulty
Intermediate
Structure
Lessons 5 · Labs 2 · Assessment

Diagrams and tables: composed by the author using each lesson's official primary sources. Find the originals and review dates at the end of that lesson.

PREREQUISITE CHECK

Three things to check before reading

This is not a test of memorized answers. Think about each question first, then open the explanation to review the foundational concepts used in this course.

1Does this unit send commands to real equipment?

No. Read the training output in the browser and make the judgment there. Any separate reproduction is done only in an approved isolated environment.

2What permissions and environment must you confirm before the lab?

lab cluster-admin·GPU reconfiguration maintenance. cluster network·NCCL test fabric.

3What evidence did you record in the previous unit, "GPU isolation and sharing"?

The task is complete when you choose a mode for each of the two workloads based on its memory, SLO, and failure impact, and present the resources, quota, and observability metrics.

TEXTBOOK GUIDE

Main text that covers each concept from its background to the criteria for judging it

We explain the material section by section so readers new to IT can connect causes and effects without memorizing terms.

  1. Explain the components and failure boundaries of distributed GPU workloads using a diagram.
  2. Judge the state of distributed GPU workloads from command output and observed values.
  3. Document the stop conditions and recovery evidence for distributed GPU workloads in a work record.
Distributed GPU workloads Lab environment and safety boundaries
Hardware2-node GPU cluster fixture·MIG-capable inventory
SoftwareKubernetes 1.31 fixture·NVIDIA device plugin·DCGM exporter
Required permissionslab cluster-admin·GPU reconfiguration maintenance
Networkingcluster network·NCCL test fabric

Reviewed against official documentation and training output. Commands and performance tests on real hardware are unconfirmed.

Applies to version: Kubernetes Device Plugin API stable v1beta1 · NVIDIA MIG Guide current documentation · Manuscript review date: 2026-09-01

CONCEPT FLOW

How the chapters connect

The chapters are not isolated short answers to memorize. Follow them from left to right to see how each chapter's concepts support the next decision.

  1. 1.Start the check at the job spec
  2. 2.Pins down the lab target for placement
  3. 3.Distinguish the output of the collective from what it means
  4. 4.Decide whether to proceed or stop at the result verdict
  5. 5.Re-verify recovery for distributed GPU workloads
Distributed GPU workloads: the overall map. If you lose track while reading the detailed explanations and chapters below, return to this sequence.

CONTROLLED EXPLANATION

Follow the evidence to check, one step at a time

Current explanation · 1/5 · Start the check at the job spec

Up next: Pins down the lab target for placement

  1. Start the check at the job spec

    Do not guess the cause and start by changing settings. If you group the following evidence into records from the same time window, another operator can reproduce the boundary at which the expected state broke.

  2. Pins down the lab target for placement

    Lab scenario:: In the 4-node all-reduce fixture, find the rank that selected the wrong NIC and write a reassignment and verification plan. Instructions:: In the browser, read the training output below and write a verdict. Do not send the commands to real equipment. To reproduce the commands separately, prepare an approved isolated environment with the relevant tools and example files. Save the entire output, and if you see a missing rank, topology variation, or rising retries, do not move on to the next change.

  3. Distinguish the output of the collective from what it means

    The point is not to memorize the values themselves but to confirm that each rank uses the intended transport and that the performance spread is within the acceptance range. The values shown are reproduced examples for training, not measurements taken on real equipment. Identifiers and values can differ by device, driver, and cluster.

  4. Decide whether to proceed or stop at the result verdict

    Success means submitting the rank map, topology, transport logs, collective distribution, fabric counters, and the reproduction command as one evidence package. Record the execution time, target identity, commands used, key output, verdict, and next action together in the result.

  5. Re-verify recovery for distributed GPU workloads

    If one rank uses a different transport, preserve the logs and placement before restarting the job. Retest all ranks with a new revision that fixes the network annotation and device visibility. After recovery, measure again with the same commands and the same success criteria. Do not close an incident just because things appear normal.

Conceptual explanation 01

Link rank placement and the fabric to the collective results

Rank (participant number in a distributed job): the number that distinguishes each process within the set of participating processes defined by the world size.

Distributed training and serving require the rank, world size and rendezvous, the GPU/NIC topology, the collective library and the fabric to line up at the same time. A slow data path or retries on a single rank delay the whole job at the barrier.

A collective uses algorithms such as ring or tree depending on topology and message size. If scheduler placement puts ranks on different slow paths, or the wrong NIC is selected, GPU utilization can look high while communication wait increases.

Beyond pass or fail, tie each rank's hostname, GPU UUID, NIC, NUMA, and logs, along with the collective distribution, to a run ID. Preserve the Pod and node events before the failing rank disappears.

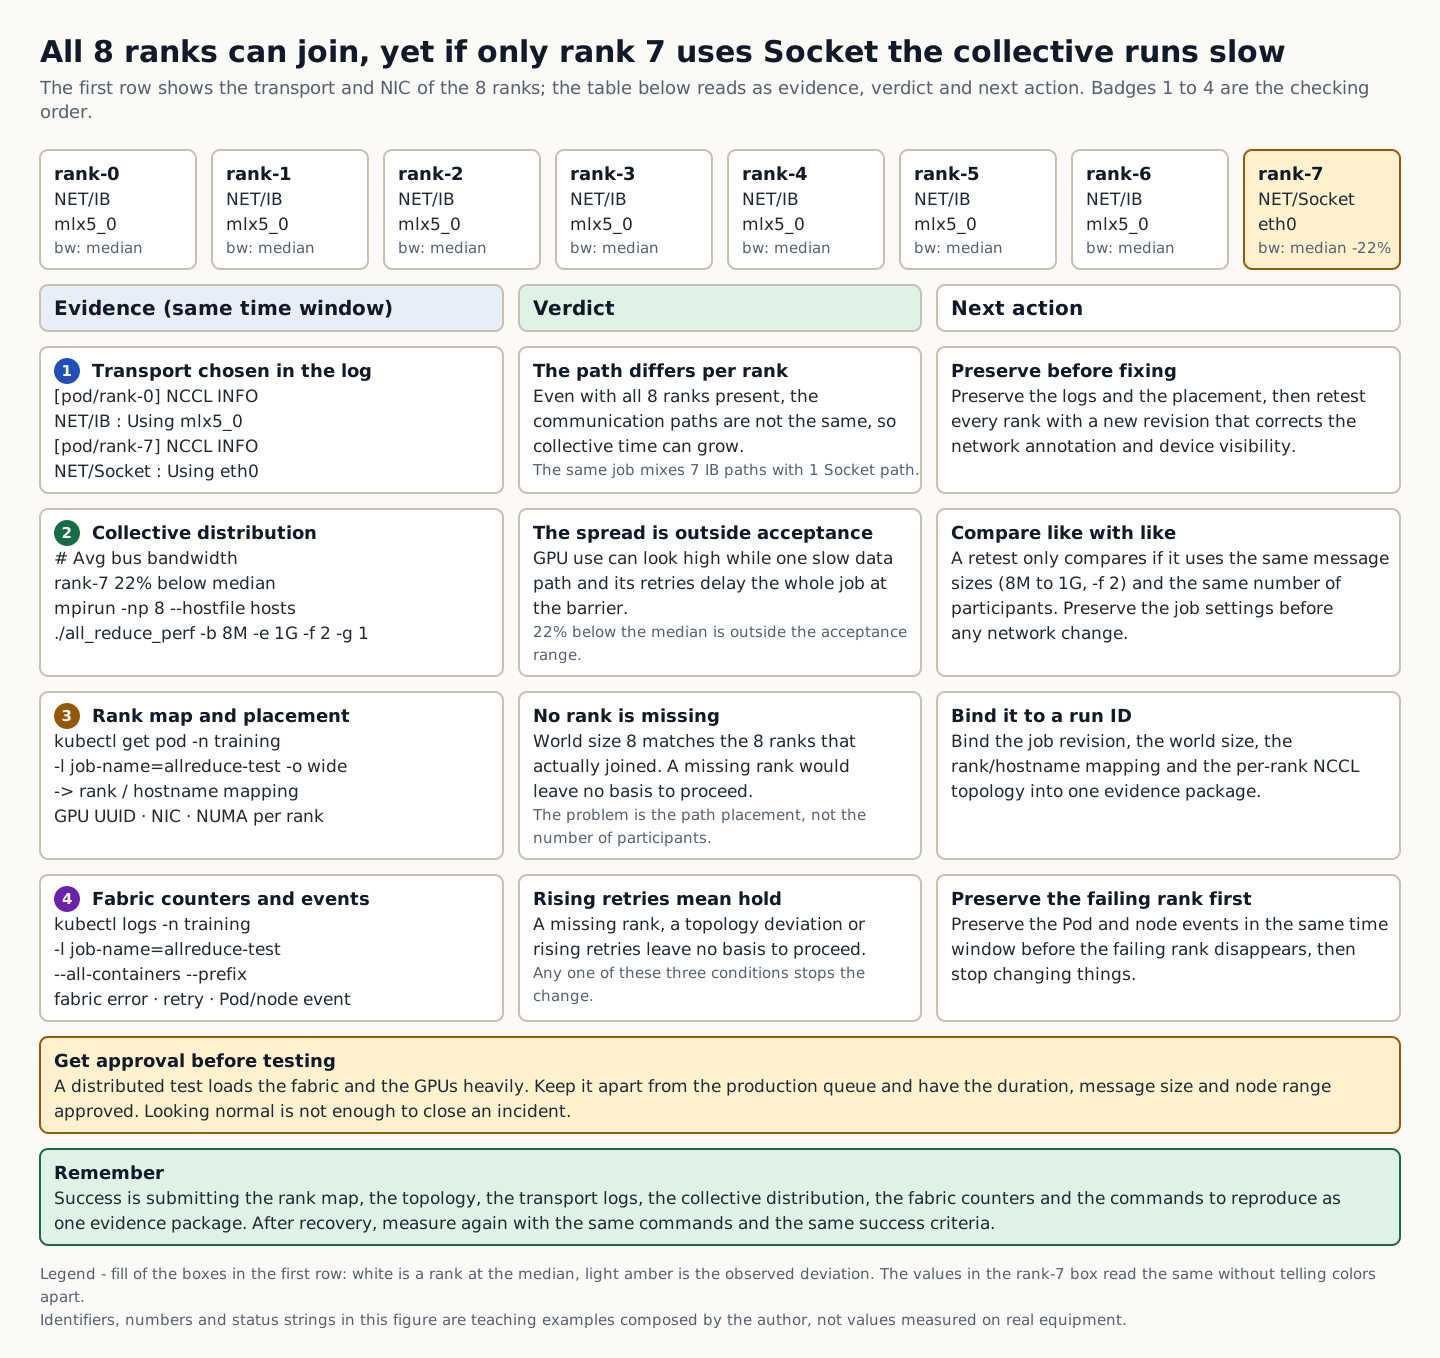
In the training example only rank 7 chose the Socket transport while the rest used the IB transport. Even with the correct rank count, the communication paths are not the same, so collective time can grow. Link the transport choice in the log with the GPU and NIC placement for each rank. Preserve the job configuration before changing the network and retest with the same message size and participant count so the comparison holds.

A table that lists the transport and NIC of ranks 0 to 7 side by side and judges the Socket path of rank 7 in three columns: evidence, verdict, and next action
How to read the figure In the first row, read the transport and NIC of ranks 0 to 7 side by side. Seven ranks use NET/IB and mlx5_0, while only rank 7 uses NET/Socket and eth0, with bandwidth 22% below the median. The table below shows evidence · verdict · next action from left to right, and badges 1 to 4 give the order of checks. The verdict cell states whether to proceed: if any of a missing rank, a topology deviation, or increased retries applies, stop the change. The next action cell means preserving the logs and placement before fixing anything and retesting only with the same message size and the same number of participants. In the first row, a white fill marks a rank equal to the median and a light amber fill marks an observed deviation, and the figure can be read from the values without distinguishing colors. The figure does not depict physical cabling or time proportions; it shows only how evidence connects to verdicts, and the identifiers and numbers in it are training examples composed by the author. Source: composed by the author based on NVIDIA NCCL User Guide · NVIDIA nccl-tests.
Why does this happen?
A collective uses algorithms such as ring or tree depending on the topology and the message size. If scheduler placement puts ranks on different slow paths or the NIC selection is wrong, GPU utilization can look high while communication wait grows.
When is it a problem?
If you see a missing rank, topology variance, or rising retries, there are insufficient grounds to proceed.
Common beginner misconceptions
Distributed tests put a heavy load on the fabric and GPUs. Keep them separate from the production queue, and get the duration, message size, and node range approved.
How to verify it yourself
Save the job revision, world size, and rank-to-hostname mapping. Collect each rank's GPU UUID, NIC, and NUMA node, along with the NCCL topology.
To summarize this sectionYou succeed when you submit the rank map, topology, transport logs, collective distribution, fabric counters, and the reproduction commands as one evidence package.

CHAPTER 1 / 5

Start the check at the job spec

Do not guess the cause and start by changing settings. If you group the following evidence into records from the same time window, another operator can reproduce the boundary at which the expected state broke.

1. Store the job revision, world size, and the rank/hostname mapping. 2. Collect the GPU UUID, NIC, and NUMA node for each rank, along with the NCCL topology. 3. Compare the bandwidth per message size and the duration distribution per rank. 4. Correlate fabric errors, retries, and Pod/node events in the same time window.

CHAPTER 2 / 5

Pins down the lab target for placement

Commands for reproducing the isolated environment · do not run them in the browser
kubectl logs -n training -l job-name=allreduce-test --all-containers --prefix
kubectl get pod -n training -l job-name=allreduce-test -o wide
mpirun -np 8 --hostfile hosts ./all_reduce_perf -b 8M -e 1G -f 2 -g 1

CHAPTER 3 / 5

Distinguish the output of the collective from what it means

Expected output for training · not an actual measurement
[pod/rank-0] NCCL INFO NET/IB : Using mlx5_0
[pod/rank-7] NCCL INFO NET/Socket : Using eth0
# Avg bus bandwidth rank-7 22% below median

CHAPTER 4 / 5

Decide whether to proceed or stop at the result verdict

CHAPTER 5 / 5

Re-verify recovery for distributed GPU workloads

CONCRETE CASES

In the 4-node all-reduce fixture, find the rank that selected the wrong NIC and write a reassignment and verification plan.

Beyond pass or fail, tie each rank's hostname, GPU UUID, NIC, NUMA, and logs, along with the collective distribution, to a run ID. Preserve the Pod and node events before the failing rank disappears.

Wrong responses and boundaries to check

A distributed test uses the fabric and the GPUs heavily. Separate it from the production queue and get the duration, message size and node range approved.

If one rank uses a different transport, preserve the logs and placement before restarting the job. Retest all ranks with a new revision that fixes the network annotation and device visibility. After recovery, measure again with the same commands and the same success criteria. Do not close an incident just because things appear normal.

INTERACTIVE LAB 1 / 2

Lab 1 · Find the basis for a verdict in the output

Enter values in the browser and check the execution results and the failure and recovery paths. No commands are ever sent to real equipment or the NAS.

Lab scenario:: In the 4-node all-reduce fixture, find the rank that selected the wrong NIC and write a reassignment and verification plan. Instructions:: In the browser, read the training output below and write a verdict. Do not send the commands to real equipment. To reproduce the commands separately, prepare an approved isolated environment with the relevant tools and example files. Save the entire output, and if you see a missing rank, topology variation, or rising retries, do not move on to the next change.

[pod/rank-0] NCCL INFO NET/IB : Using mlx5_0
[pod/rank-7] NCCL INFO NET/Socket : Using eth0
# Avg bus bandwidth rank-7 22% below median

The point is not to memorize the values themselves but to confirm that each rank uses the intended transport and that the performance spread is within the acceptance range. The values shown are reproduced examples for training, not measurements taken on real equipment. Identifiers and values can differ by device, driver, and cluster.

INTERACTIVE LAB 2 / 2

Lab 2 · Plan for stopping and recovery

Enter values in the browser and check the execution results and the failure and recovery paths. No commands are ever sent to real equipment or the NAS.

A distributed test uses the fabric and the GPUs heavily. Separate it from the production queue and get the duration, message size and node range approved.

KEY TERMS

Key terms in this unit

Rank (participant number in a distributed job)
The number that distinguishes each process within the set of participating processes defined by the world size.

UNIT WORKBOOK

Exercises and worksheets for applying concepts to new situations

Start by checking basic principles, then expand to practical workplace decisions. After submitting an answer, you can see why every option is correct or incorrect, not just the correct answer.

Document the stop conditions and recovery evidence for distributed GPU workloads in a work record.

PERSONAL WORKSHEET

A learning worksheet you adapt to your own environment

Your input remains only on the current browser screen and is not stored or transmitted externally. Use categories and pseudonyms instead of actual sensitive information.

OFFICIAL SOURCES

Verify against official sources

Reviewed against official documentation and training output. Commands and performance tests on real hardware are unconfirmed.

DECISION ACTIVITY

A Pod is Pending while the GPU is visible on the node. What do you check first?

First write down the evidence you need and the stop criteria, then choose a verdict.

Choose an answer

THREE-LEVEL ASSESSMENT

From basic principles to operational decisions

When you submit an answer you can see why every option is right or wrong.

Basic Question 1

For Kubernetes to schedule a GPU, what does the vendor device plugin do?

Choose an answer
Apply Question 2

What is the key difference between MIG and time-slicing?

Choose an answer
Capstone Question 3

What evidence is required to approve a distributed job?

Choose an answer

LEARNING RECORD

Have you reviewed the text, decision activities, and all explanations?

Completion status is stored only in this browser.