KoreaDevKNOWLEDGE SHARING

Content typeLearn

AI INFRASTRUCTURE · 11 / 12

AI model serving

Complete the production serving path from the model artifact and runtime through GPU placement, API, security, performance, capacity, and safe rollout.

Difficulty
Intermediate
Structure
Core units 3 · Judgment activities · Three-stage assessment

NEW HIRE ONBOARDING

Start in the order you would receive your first assignment

So that even a new hire with no prior IT background can follow along, we start with the situation, the task, the evidence, and when to report, before difficult definitions.

  1. 01

    Read the situation in one sentence

    Pin the combination of artifact, tokenizer, and runtime, and verify API security, input conditions, time to first response, and failure boundaries at each concurrency level.

  2. 02

    Today's assignment

    Document the stop conditions and recovery evidence for performance and capacity verification in a work record.

  3. 03

    Evidence that shows the work is complete

    Reviewed against official documentation and training output. Commands and performance tests on real hardware are unconfirmed.

  4. 04

    When to stop and ask a senior colleague

    After deploying a new model you still get HTTP 200 but the answers changed. What do you check first?

Unpack unfamiliar terms first

Model artifact
It is a bundle of files, such as weights, tokenizer, and config, that lets a specific model run reproducibly.

Operational question for this course

How do you accept a model that responds as a reproducible, safe service?

Pin the combination of artifact, tokenizer, and runtime, and verify API security, input conditions, time to first response, and failure boundaries at each concurrency level.

CORE UNIT 1 / 3

Model artifact and serving runtime

Explain the boundaries between model, tokenizer, runtime, and GPU memory.

Difficulty
Intermediate
Structure
Lessons 5 · Labs 2 · Assessment

Diagrams and tables: composed by the author using each lesson's official primary sources. Find the originals and review dates at the end of that lesson.

PREREQUISITE CHECK

Three things to check before reading

This is not a test of memorized answers. Think about each question first, then open the explanation to review the foundational concepts used in this course.

1Does this unit send commands to real equipment?

No. Read the training output in the browser and make the judgment there. Any separate reproduction is done only in an approved isolated environment.

2What permissions and environment must you confirm before the lab?

Example records are read-only · no access to production models. The localhost examples refer only to the isolated lab server.

3How do you record a value you have never seen before and a test you have not yet run?

Record it as unconfirmed. Distinguish expected training output from actual measurements, and do not fill in blanks with unapproved work.

TEXTBOOK GUIDE

Main text that covers each concept from its background to the criteria for judging it

We explain the material section by section so readers new to IT can connect causes and effects without memorizing terms.

  1. Explain the components and failure boundaries of the Model artifact and serving runtime with a diagram.
  2. Judge the state of the Model artifact and serving runtime from command output and observed values.
  3. Write the stop conditions and recovery evidence for the Model artifact and serving runtime into a work record.
Model artifact and serving runtime Lab environment and safety boundaries
HardwareModel repository, request results, and load test fixtures
SoftwareTriton V2 protocol and OpenAI-compatible API examples
Required permissionsExample records are read-only · no access to production models
NetworkingThe localhost examples refer only to the isolated lab server

Reviewed against official documentation and training output. Commands and performance tests on real hardware are unconfirmed.

Applies to version: Triton inference protocol V2 · vLLM Installed version unconfirmed · examples focused on the API contract · Manuscript review date: 2026-09-01

CONCEPT FLOW

How the chapters connect

The chapters are not isolated short answers to memorize. Follow them from left to right to see how each chapter's concepts support the next decision.

  1. 1.Start the checks at the artifact bundle
  2. 2.Pins down the lab target for the runtime combination
  3. 3.Distinguishes model load output from its meaning
  4. 4.Make the go/stop decision on the inference check
  5. 5.Re-verify recovery of the Model artifact and serving runtime
Model artifact and serving runtime: the overall map. If you lose track while reading the detailed explanations and chapters below, return to this sequence.

CONTROLLED EXPLANATION

Follow the evidence to check, one step at a time

Current explanation · 1/5 · Start the checks at the artifact bundle

Up next: Pins down the lab target for the runtime combination

  1. Start the checks at the artifact bundle

    Do not guess the cause and start by changing settings. If you group the following evidence into records from the same time window, another operator can reproduce the boundary at which the expected state broke.

  2. Pins down the lab target for the runtime combination

    Lab scenario:: In the fixture below, a successful live check and a model ready failure appear together. Decide whether to switch traffic and which load log to read next. Instructions:: In the browser, read the training output below and write a verdict. Do not send the commands to real equipment. To reproduce the commands separately, prepare an approved isolated environment with the relevant tools and example files. Save the entire output, and if there is a digest mismatch or a model load failure, do not move on to the next change.

  3. Distinguishes model load output from its meaning

    The point is not to memorize the values themselves but to confirm that, in the training fixture, process liveness was verified while model readiness for version 2 failed. The values shown are reproduced examples for training, not measurements taken on real equipment. Identifiers and values can differ by device, driver, and cluster.

  4. Make the go/stop decision on the inference check

    Success means holding the traffic switch and laying out the order for checking the missing artifact, the backend logs, and the checksums. Record the execution time, target identity, commands used, key output, verdict, and next action together in the result.

  5. Re-verify recovery of the Model artifact and serving runtime

    Preserve the log and release identity of the failed model. While keeping the previously verified artifacts in place, restore the missing files in an isolated runtime and repeat the load and fixed-input tests. After recovery, measure again with the same commands and the same success criteria. Do not close an incident just because things appear normal.

Conceptual explanation 01

Check artifact identity and model readiness separately

Model artifact: the bundle of files, such as the weights, tokenizer, and config, that makes a particular model reproducibly runnable.

A model artifact is more than the weights file. The tokenizer, configuration, chat template, and any required preprocessing rules must also be present for the same input to become the same tokens and tensors. The combination of runtime image and driver also affects execution results and supported formats.

A Triton model repository links numeric version directories and configuration under a model name. Even when the server is running, if a particular backend cannot read a model, that model is not ready. vLLM's API compatibility likewise does not mean every model supports the same features and templates.

In the fixture, model 1 is ready while model 2 failed to load because a tokenizer file is missing. Shifting traffic to model 2 just because the server liveness check returns 200 makes real requests fail. The deployment manifest must preserve both the file checksums and the runtime image digest.

In the fixture below, a successful live check and a model ready failure appear together. Decide whether to switch traffic and which load log to read next.
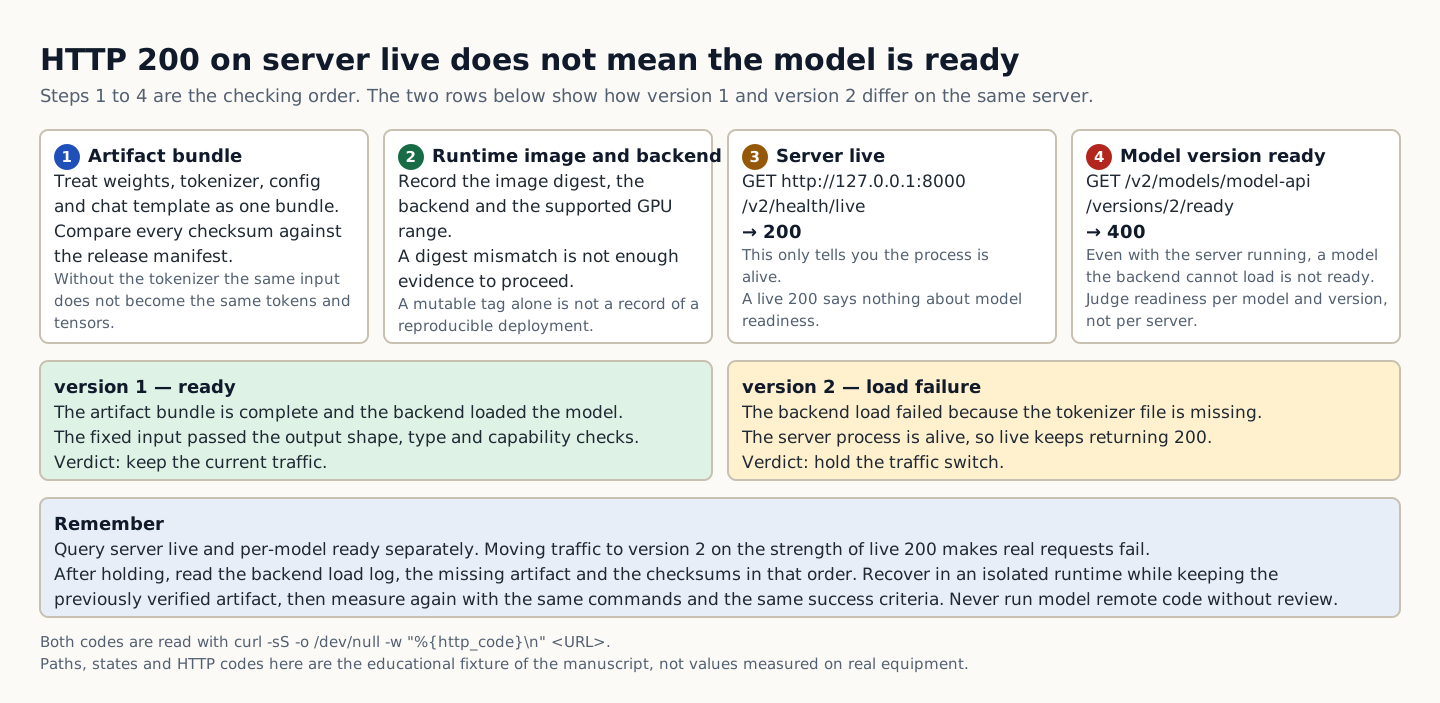
A check sequence in which live returns 200 on the same server but ready for model version 2 returns 400, so the traffic switch is held.
How to read the figure Badges 1 to 4 in the top row give the order of checks. Steps 1 and 2 compare the checksums of the weights, tokenizer, config, and chat template, as well as the runtime image digest, against the release manifest. In step 3, GET /v2/health/live returns 200, but in step 4, GET /v2/models/model-api/versions/2/ready returns 400, so server liveness and model readiness diverge. The two boxes below show, side by side, the same server with version 1 ready and version 2 failing to load because a tokenizer file is missing. Moving traffic to version 2 based on the live 200 would make real requests fail, so hold the switch. After holding, read the backend load log, the missing artifact, and the checksums in that order, recover in an isolated runtime while keeping the previously verified artifact, and then measure again with the same commands and the same success criteria. The paths, states, and HTTP codes in the figure are a training fixture, not values measured on real equipment. Source: composed by the author based on NVIDIA Triton Model Repository · vLLM OpenAI-Compatible Server · Triton Health Extension.
Why does this happen?
A Triton model repository ties numbered version directories and a configuration to each model name. Even if the server is running, a model is not ready when its backend cannot load it. Likewise, vLLM API compatibility does not mean that every model supports the same features and templates.
When is it a problem?
If you see a digest mismatch or a model load failure, there are insufficient grounds to proceed.
Common beginner misconceptions
Do not run a model's remote code without review, and do not record a deployment as reproducible based on a mutable tag alone. The HTTP codes in the text come from fixtures, so confirm the actual failure codes for your implementation and version.
How to verify it yourself
Compare the checksums of the weights, tokenizer, and config against the release manifest. Record the runtime image digest, backend, and supported GPU range.
To summarize this sectionYou succeed when you put the traffic switch on hold and present the order for checking the missing artifact, the backend log, and the checksum.

CHAPTER 1 / 5

Start the checks at the artifact bundle

Do not guess the cause and start by changing settings. If you group the following evidence into records from the same time window, another operator can reproduce the boundary at which the expected state broke.

1. Compare the weight, tokenizer, and config checksums against the release manifest. 2. Record the runtime image digest, backend, and supported GPU range. 3. Query server liveness and per-model readiness separately. 4. Inspect the output shape, type, and functional criteria for a fixed input.
CHAPTER 2 / 5

Pins down the lab target for the runtime combination

Commands for reproducing the isolated environment · do not run them in the browser
curl -sS -o /dev/null -w "%{http_code}\n" http://127.0.0.1:8000/v2/health/live
curl -sS -o /dev/null -w "%{http_code}\n" http://127.0.0.1:8000/v2/models/model-api/versions/2/ready

CHAPTER 3 / 5

Distinguishes model load output from its meaning

Expected output for training · not an actual measurement
200
400

CHAPTER 4 / 5

Make the go/stop decision on the inference check

CHAPTER 5 / 5

Re-verify recovery of the Model artifact and serving runtime

CONCRETE CASES

In the fixture below, a successful live check and a model ready failure appear together. Decide whether to switch traffic and which load log to read next.

In the fixture, model 1 is ready while model 2 failed to load because a tokenizer file is missing. Shifting traffic to model 2 just because the server liveness check returns 200 makes real requests fail. The deployment manifest must preserve both the file checksums and the runtime image digest.

Wrong responses and boundaries to check

Do not run model remote code without review, and do not record a deployment as reproducible on the strength of a mutable tag alone. The HTTP codes in the text are fixtures; check failure codes against your implementation and version.

Preserve the log and release identity of the failed model. While keeping the previously verified artifacts in place, restore the missing files in an isolated runtime and repeat the load and fixed-input tests. After recovery, measure again with the same commands and the same success criteria. Do not close an incident just because things appear normal.

INTERACTIVE LAB 1 / 2

Lab 1 · Find the basis for a verdict in the output

Enter values in the browser and check the execution results and the failure and recovery paths. No commands are ever sent to real equipment or the NAS.

Lab scenario:: In the fixture below, a successful live check and a model ready failure appear together. Decide whether to switch traffic and which load log to read next. Instructions:: In the browser, read the training output below and write a verdict. Do not send the commands to real equipment. To reproduce the commands separately, prepare an approved isolated environment with the relevant tools and example files. Save the entire output, and if there is a digest mismatch or a model load failure, do not move on to the next change.

200
400

The point is not to memorize the values themselves but to confirm that, in the training fixture, process liveness was verified while model readiness for version 2 failed. The values shown are reproduced examples for training, not measurements taken on real equipment. Identifiers and values can differ by device, driver, and cluster.

INTERACTIVE LAB 2 / 2

Lab 2 · Plan for stopping and recovery

Enter values in the browser and check the execution results and the failure and recovery paths. No commands are ever sent to real equipment or the NAS.

Do not run model remote code without review, and do not record a deployment as reproducible on the strength of a mutable tag alone. The HTTP codes in the text are fixtures; check failure codes against your implementation and version.

KEY TERMS

Key terms in this unit

Model artifact
It is a bundle of files, such as weights, tokenizer, and config, that lets a specific model run reproducibly.

UNIT WORKBOOK

Exercises and worksheets for applying concepts to new situations

Start by checking basic principles, then expand to practical workplace decisions. After submitting an answer, you can see why every option is correct or incorrect, not just the correct answer.

Write the stop conditions and recovery evidence for the Model artifact and serving runtime into a work record.

PERSONAL WORKSHEET

A learning worksheet you adapt to your own environment

Your input remains only on the current browser screen and is not stored or transmitted externally. Use categories and pseudonyms instead of actual sensitive information.

OFFICIAL SOURCES

Verify against official sources

Reviewed against official documentation and training output. Commands and performance tests on real hardware are unconfirmed.

CORE UNIT 2 / 3

Deployment · API · security

Design the probes, gateway, TLS, authentication, rate limits, and rollback.

Difficulty
Intermediate
Structure
Lessons 5 · Labs 2 · Assessment

Diagrams and tables: composed by the author using each lesson's official primary sources. Find the originals and review dates at the end of that lesson.

PREREQUISITE CHECK

Three things to check before reading

This is not a test of memorized answers. Think about each question first, then open the explanation to review the foundational concepts used in this course.

1Does this unit send commands to real equipment?

No. Read the training output in the browser and make the judgment there. Any separate reproduction is done only in an approved isolated environment.

2What permissions and environment must you confirm before the lab?

Example records are read-only · no access to production models. The localhost examples refer only to the isolated lab server.

3What evidence did you record in the previous unit, "Model artifacts and serving runtime"?

Success means holding the traffic switch and laying out the order for checking the missing artifact, the backend logs, and the checksums.

TEXTBOOK GUIDE

Main text that covers each concept from its background to the criteria for judging it

We explain the material section by section so readers new to IT can connect causes and effects without memorizing terms.

  1. Explain the components and failure boundaries of deployment, API, and security using a diagram.
  2. Judge the state of deployment, API, and security from command output and observed values.
  3. Document the stop conditions and recovery evidence for deployment, API, and security in a work record.
Deployment · API · security Lab environment and safety boundaries
HardwareModel repository, request results, and load test fixtures
SoftwareTriton V2 protocol and OpenAI-compatible API examples
Required permissionsExample records are read-only · no access to production models
NetworkingThe localhost examples refer only to the isolated lab server

Reviewed against official documentation and training output. Commands and performance tests on real hardware are unconfirmed.

Applies to version: Triton inference protocol V2 · vLLM Installed version unconfirmed · examples focused on the API contract · Manuscript review date: 2026-09-01

CONCEPT FLOW

How the chapters connect

The chapters are not isolated short answers to memorize. Follow them from left to right to see how each chapter's concepts support the next decision.

  1. 1.Start the checks at the external request
  2. 2.Pins down the lab target for gateway limits
  3. 3.Distinguishes ready replica output from its meaning
  4. 4.Make the go/stop decision on response and termination
  5. 5.Re-verify recovery for deployment, API and security
Deployment · API · security: the overall map. If you lose track while reading the detailed explanations and chapters below, return to this sequence.

CONTROLLED EXPLANATION

Follow the evidence to check, one step at a time

Current explanation · 1/5 · Start the checks at the external request

Up next: Pins down the lab target for gateway limits

  1. Start the checks at the external request

    Do not guess the cause and start by changing settings. If you group the following evidence into records from the same time window, another operator can reproduce the boundary at which the expected state broke.

  2. Pins down the lab target for gateway limits

    Lab scenario:: Read the training access test record to see whether any unauthenticated bypass exists. Do not issue tokens yourself or call external APIs. Instructions:: In the browser, read the training output below and write a verdict. Do not send the commands to real equipment. To reproduce the commands separately, prepare an approved isolated environment with the relevant tools and example files. Save the entire output, and if you see an authentication bypass, raw input logging, or unbounded requests, do not move on to the next change.

  3. Distinguishes ready replica output from its meaning

    The point is not to memorize the values themselves but to confirm that the three gateway tests match expectations while the 200 from the direct runtime is a security boundary failure. The values shown are reproduced examples for training, not measurements taken on real equipment. Identifiers and values can differ by device, driver, and cluster.

  4. Make the go/stop decision on response and termination

    You succeed when you classify direct access that is not blocked as a reason to stop the release and, after fixing it, repeat the normal, denial, and stream-cancellation tests. Record the execution time, target identity, commands used, key output, verdict, and next action together in the result.

  5. Re-verify recovery for deployment, API and security

    If a bypass path exists, stop switching public traffic and restore the access policy. For credentials that have already been exposed, follow the established revocation procedure, record the scope and time, and then rerun the denial test. After recovery, measure again with the same commands and the same success criteria. Do not close an incident just because things appear normal.

Conceptual explanation 01

API protection tests both the allowed and denied paths

API boundary: the point that inspects the caller's identity, permissions, input scope, and resource use.

An inference endpoint is a boundary that touches not only GPU resources but also user input and output. TLS protects transport, authentication identifies the caller, and authorization controls the scope of model use. Success in one does not substitute for the others.

The gateway checks authentication, request size, and rate limits, while the runtime validates the model input format and generation limits. Send traffic only to replicas that have passed readiness, and on shutdown block new requests and drain the ones in flight. For streaming, also record separately the errors and cancellations that occur after the connection is open.

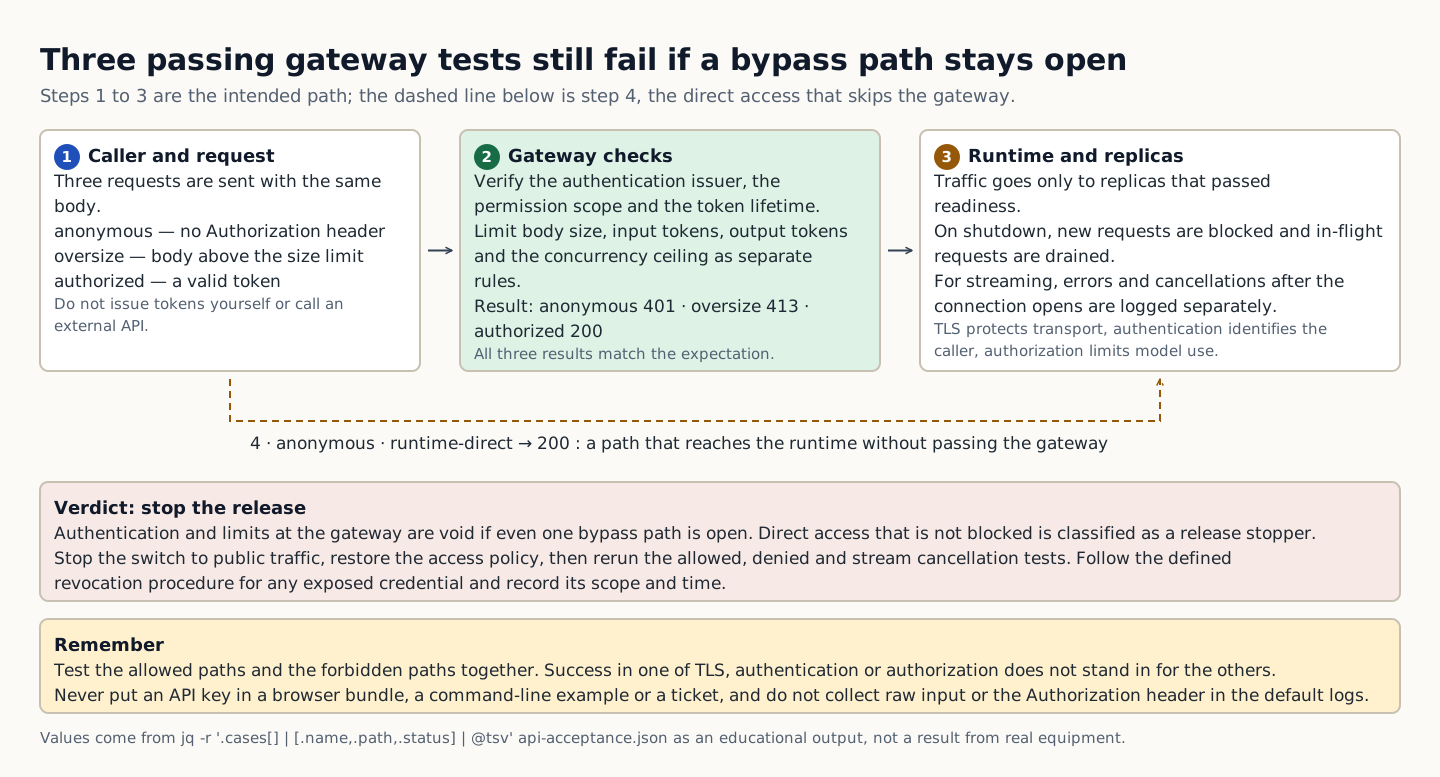
In the example, the expected responses are 401 for an unauthenticated request, 413 for oversized input, and 200 for a normal authenticated request. If the internal runtime is exposed in a way that bypasses the gateway, the gateway's authentication and limits become ineffective. Therefore, test both the allowed paths and the forbidden paths.

Read the training access test record to see whether any unauthenticated bypass exists. Do not issue tokens yourself or call external APIs.

Three requests through the gateway return 401, 413, and 200 as expected, but direct runtime access that bypasses the gateway returns 200, so the release is stopped.
How to read the figure Badges 1 to 3 on the left are the intended path. Step 1 is three requests (anonymous, oversize, and authorized) sent with the same body. In step 2, the gateway checks the authentication issuer, permission scope, and token lifetime, as well as body size, input tokens, output tokens, and the concurrency limit, and returns 401, 413, and 200. Step 3 sends traffic only to replicas that passed readiness, blocks new requests during shutdown, and drains in-flight requests. The dashed line below is bypass path 4, in which an anonymous request reaches the runtime directly without passing through the gateway and receives 200. Even if the three tests match expectations, an open path like this nullifies the gateway's authentication and limits, so stop the release. Halt the switch to public traffic, restore the access policy, rerun the allowed, denied, and stream cancellation tests, and follow the established revocation procedure for any credential already exposed. The figure shows only request paths and verdicts, not physical cabling or time proportions. Source: composed by the author based on Kubernetes Liveness, Readiness and Startup Probes · Kubernetes Network Policies · vLLM OpenAI-Compatible Server.
Why does this happen?
The gateway checks authentication, request size, and rate limits, while the runtime validates the model's input format and generation limits. Traffic goes only to replicas that pass readiness, and on shutdown new requests must be blocked while in-flight requests are drained. For streaming, errors and cancellations after the connection is open are recorded separately.
When is it a problem?
If you see an authentication bypass, raw input logging, or unlimited requests, there are insufficient grounds to proceed.
Common beginner misconceptions
Do not put API keys in browser bundles, command-line examples, or tickets. Do not collect raw input or the Authorization header in the default logs.
How to verify it yourself
Check the authentication issuer, the permission scope, and the token lifetime. Keep the body size, input tokens, output tokens, and the concurrency ceiling as separate limits.
To summarize this sectionYou succeed when you classify direct access that is not blocked as a reason to stop the release and, after fixing it, repeat the normal, denial, and stream-cancellation tests.

CHAPTER 1 / 5

Start the checks at the external request

Do not guess the cause and start by changing settings. If you group the following evidence into records from the same time window, another operator can reproduce the boundary at which the expected state broke.

1. Check the authentication issuer, scope of authority, and token lifetime. 2. Separate the body size, input token count, output token count, and the concurrency limit. 3. Check whether runtime access that bypasses the gateway is blocked. 4. Compare request results for the normal, unauthenticated, insufficient-permission, cancelled, and mid-rollout cases.

CHAPTER 2 / 5

Pins down the lab target for gateway limits

Commands for reproducing the isolated environment · do not run them in the browser
jq -r '.cases[] | [.name,.path,.status] | @tsv' api-acceptance.json

CHAPTER 3 / 5

Distinguishes ready replica output from its meaning

Expected output for training · not an actual measurement
anonymous	gateway	401
oversize	gateway	413
authorized	gateway	200
anonymous	runtime-direct	200

CHAPTER 4 / 5

Make the go/stop decision on response and termination

CHAPTER 5 / 5

Re-verify recovery for deployment, API and security

CONCRETE CASES

Read the training access test record to see whether any unauthenticated bypass exists. Do not issue tokens yourself or call external APIs.

In the example, the expected responses are 401 for an unauthenticated request, 413 for oversized input, and 200 for a normal authenticated request. If the internal runtime is exposed in a way that bypasses the gateway, the gateway's authentication and limits become ineffective. Therefore, test both the allowed paths and the forbidden paths.

Wrong responses and boundaries to check

Do not put API keys in browser bundles, command-line examples, or tickets. Do not collect raw input or the Authorization header in the default logs.

If a bypass path exists, stop switching public traffic and restore the access policy. For credentials that have already been exposed, follow the established revocation procedure, record the scope and time, and then rerun the denial test. After recovery, measure again with the same commands and the same success criteria. Do not close an incident just because things appear normal.

INTERACTIVE LAB 1 / 2

Lab 1 · Find the basis for a verdict in the output

Enter values in the browser and check the execution results and the failure and recovery paths. No commands are ever sent to real equipment or the NAS.

Lab scenario:: Read the training access test record to see whether any unauthenticated bypass exists. Do not issue tokens yourself or call external APIs. Instructions:: In the browser, read the training output below and write a verdict. Do not send the commands to real equipment. To reproduce the commands separately, prepare an approved isolated environment with the relevant tools and example files. Save the entire output, and if you see an authentication bypass, raw input logging, or unbounded requests, do not move on to the next change.

anonymous	gateway	401
oversize	gateway	413
authorized	gateway	200
anonymous	runtime-direct	200

The point is not to memorize the values themselves but to confirm that the three gateway tests match expectations while the 200 from the direct runtime is a security boundary failure. The values shown are reproduced examples for training, not measurements taken on real equipment. Identifiers and values can differ by device, driver, and cluster.

INTERACTIVE LAB 2 / 2

Lab 2 · Plan for stopping and recovery

Enter values in the browser and check the execution results and the failure and recovery paths. No commands are ever sent to real equipment or the NAS.

Do not put API keys in browser bundles, command-line examples, or tickets. Do not collect raw input or the Authorization header in the default logs.

KEY TERMS

Key terms in this unit

API boundary
The point that checks the caller's identity, permissions, input scope, and resource usage.

UNIT WORKBOOK

Exercises and worksheets for applying concepts to new situations

Start by checking basic principles, then expand to practical workplace decisions. After submitting an answer, you can see why every option is correct or incorrect, not just the correct answer.

Document the stop conditions and recovery evidence for deployment, API, and security in a work record.

PERSONAL WORKSHEET

A learning worksheet you adapt to your own environment

Your input remains only on the current browser screen and is not stored or transmitted externally. Use categories and pseudonyms instead of actual sensitive information.

OFFICIAL SOURCES

Verify against official sources

Reviewed against official documentation and training output. Commands and performance tests on real hardware are unconfirmed.

CORE UNIT 3 / 3

Performance and capacity verification

Judge capacity from TTFT, TPOT, throughput, and concurrency conditions.

Difficulty
Intermediate
Structure
Lessons 5 · Labs 2 · Assessment

Diagrams and tables: composed by the author using each lesson's official primary sources. Find the originals and review dates at the end of that lesson.

PREREQUISITE CHECK

Three things to check before reading

This is not a test of memorized answers. Think about each question first, then open the explanation to review the foundational concepts used in this course.

1Does this unit send commands to real equipment?

No. Read the training output in the browser and make the judgment there. Any separate reproduction is done only in an approved isolated environment.

2What permissions and environment must you confirm before the lab?

Example records are read-only · no access to production models. The localhost examples refer only to the isolated lab server.

3What evidence did you record in the previous unit, "Deployment, API, and security"?

You succeed when you classify direct access that is not blocked as a reason to stop the release and, after fixing it, repeat the normal, denial, and stream-cancellation tests.

TEXTBOOK GUIDE

Main text that covers each concept from its background to the criteria for judging it

We explain the material section by section so readers new to IT can connect causes and effects without memorizing terms.

  1. Explain the components and failure boundaries of performance and capacity verification using a diagram.
  2. Judge the state of performance and capacity verification from command output and observed values.
  3. Document the stop conditions and recovery evidence for performance and capacity verification in a work record.
Performance and capacity verification Lab environment and safety boundaries
HardwareModel repository, request results, and load test fixtures
SoftwareTriton V2 protocol and OpenAI-compatible API examples
Required permissionsExample records are read-only · no access to production models
NetworkingThe localhost examples refer only to the isolated lab server

Reviewed against official documentation and training output. Commands and performance tests on real hardware are unconfirmed.

Applies to version: Triton inference protocol V2 · vLLM Installed version unconfirmed · examples focused on the API contract · Manuscript review date: 2026-09-01

CONCEPT FLOW

How the chapters connect

The chapters are not isolated short answers to memorize. Follow them from left to right to see how each chapter's concepts support the next decision.

  1. 1.Start the checks at the fixed inputs
  2. 2.Fix the lab target for changing concurrency
  3. 3.Distinguishes p95 TTFT output from its meaning
  4. 4.Decides whether the SLO assessment proceeds or stops
  5. 5.Re-verify recovery of performance and capacity verification
Performance and capacity verification: the overall map. If you lose track while reading the detailed explanations and chapters below, return to this sequence.

CONTROLLED EXPLANATION

Follow the evidence to check, one step at a time

Current explanation · 1/5 · Start the checks at the fixed inputs

Up next: Fix the lab target for changing concurrency

  1. Start the checks at the fixed inputs

    Do not guess the cause and start by changing settings. If you group the following evidence into records from the same time window, another operator can reproduce the boundary at which the expected state broke.

  2. Fix the lab target for changing concurrency

    Lab scenario:: From the fixed fixture below, choose the candidate that meets the 1-second TTFT target and write down the additional tests. Do not generate real load. Instructions:: In the browser, read the training output below and write a verdict. Do not send the commands to real equipment. To reproduce the commands separately, prepare an approved isolated environment with the relevant tools and example files. Save the entire output, and if the TTFT target is exceeded, OOM occurs, or cancellations rise, do not move on to the next change.

  3. Distinguishes p95 TTFT output from its meaning

    The point is not to memorize the values themselves but to confirm that zero errors and higher throughput alone cannot excuse a violation of the TTFT target. The values shown are reproduced examples for training, not measurements taken on real equipment. Identifiers and values can differ by device, driver, and cluster.

  4. Decides whether the SLO assessment proceeds or stops

    The task is complete when you choose concurrency 4 as the candidate for further verification and build a capacity table that includes TPOT, bursts, cache conditions, and recovery headroom. Record the execution time, target identity, commands used, key output, verdict, and next action together in the result.

  5. Re-verify recovery of performance and capacity verification

    If the stop line is crossed, stop new load and save the state of in-flight requests, memory, and the queue. Return to the last concurrency level that passed, then re-measure with the same input distribution and cache conditions. After recovery, measure again with the same commands and the same success criteria. Do not close an incident just because things appear normal.

Conceptual explanation 01

When raising concurrency, look at throughput and user latency together

TTFT (Time To First Token): the time taken from starting a request until the first output token is received.

Time To First Token (TTFT) is affected by queueing and prefill, while Time Per Output Token (TPOT) describes the decode phase. Even when overall token/s is high, an individual user can experience a long wait, so do not approve capacity on a single indicator.

As concurrent requests grow, batching efficiency can improve, but the KV cache and the queue also grow. Unless you fix the input length, output length, cache hit rate, precision and model digest, you end up comparing different jobs. Warmup and the measurement window must also be separated.

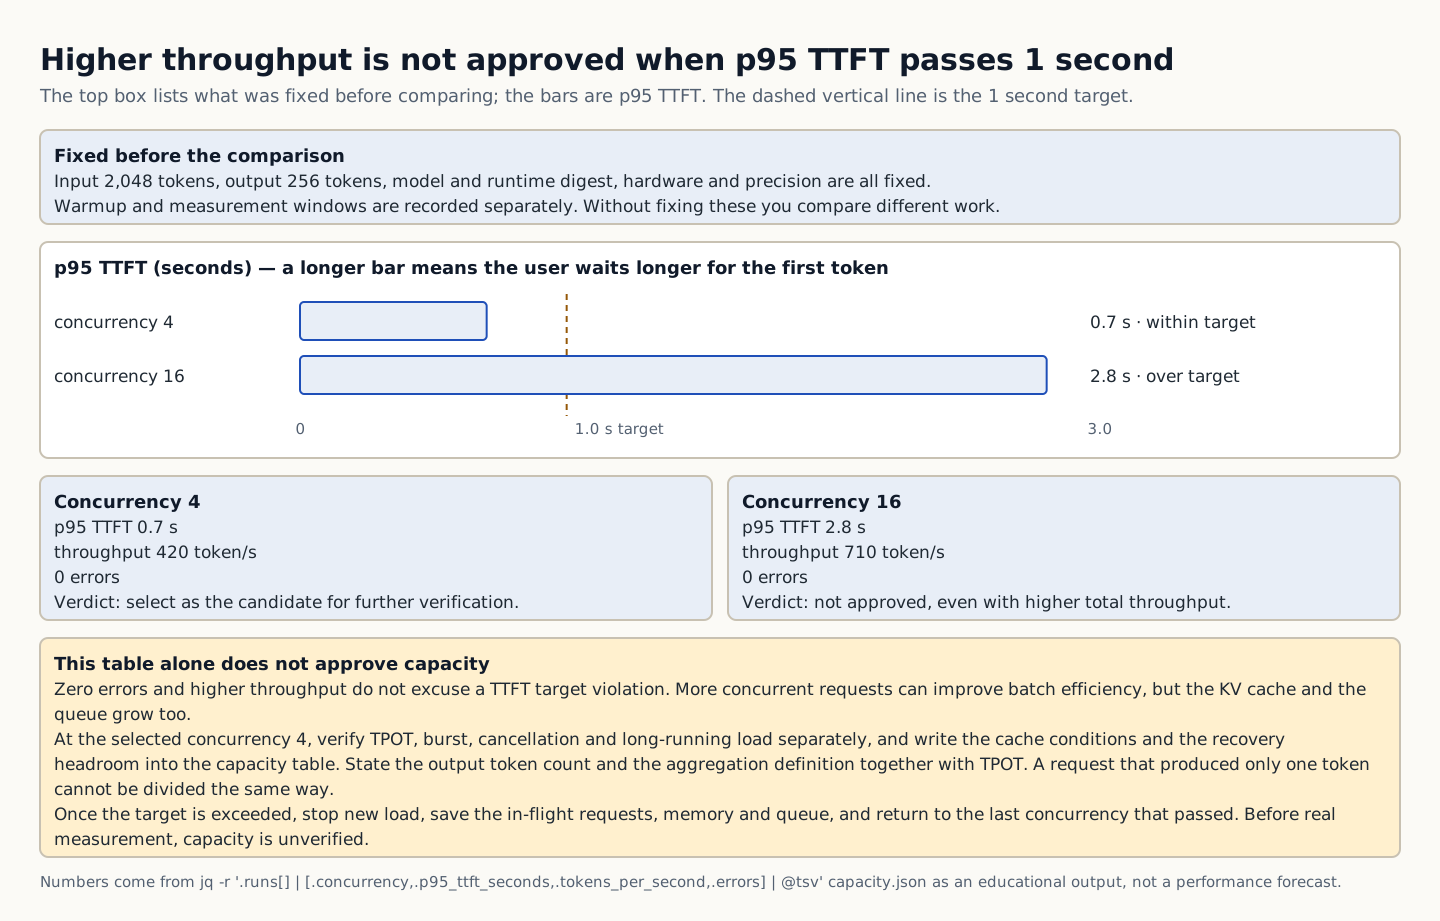
In this learning fixture, with a load of 2,048 input and 256 output tokens, p95 TTFT is 0.7 seconds at concurrency 4 and 2.8 seconds at 16. If the target is 1 second or less, do not approve the second configuration, even though its total throughput is higher. These figures are a fixture for practicing judgment, not a performance prediction.

From the fixed fixture below, choose the candidate that meets the 1-second TTFT target and write down the additional tests. Do not generate real load.

Under a load fixed at 2,048 input tokens and 256 output tokens, the p95 TTFT is 0.7 s at concurrency 4 and 2.8 s at concurrency 16, exceeding the 1 second target.
How to read the figure The top box lists the conditions fixed before comparison. Unless input of 2,048 tokens, output of 256 tokens, the model and runtime digests, the hardware, and the precision are fixed, and warmup is separated from the measurement window, you end up comparing different workloads. The horizontal bars in the middle show p95 TTFT, and the vertical dashed line is the 1-second target. Concurrency 4 is within the target at 0.7 s, while concurrency 16 exceeds it at 2.8 s. In the two boxes below, both cases have 0 errors and throughput rises from 420 to 710 token/s, but higher total throughput is no reason to approve a TTFT target violation. Concurrency 4 is therefore chosen as the candidate for further verification, and TPOT, bursts, cancellation, sustained load, cache conditions, and recovery headroom are checked separately. The bar lengths show only the ratio between the two fixture values and are not performance predictions. Source: composed by the author based on NVIDIA Triton Metrics · vLLM Production Metrics.
Why does this happen?
As concurrent requests grow, batching efficiency may improve, but the KV cache and the queue grow too. Unless input length, output length, cache hit rate, precision, and model digest are fixed, you end up comparing different work. The warmup and the measurement window must also be separated.
When is it a problem?
If the TTFT target is exceeded, OOM occurs, or cancellations rise, there are insufficient grounds to proceed.
Common beginner misconceptions
A TPOT calculation must state the number of output tokens and how values are aggregated. A request that produced only its first token cannot be divided in the same way. Until actually measured, capacity is unconfirmed.
How to verify it yourself
Fix the model and runtime digests, the hardware, and the precision. Record the input and output length distributions and the warmup and measurement durations.
To summarize this sectionYou succeed when you choose concurrency 4 as the candidate for further verification and build a capacity table that includes TPOT, burst, cache conditions, and recovery headroom.

CHAPTER 1 / 5

Start the checks at the fixed inputs

Do not guess the cause and start by changing settings. If you group the following evidence into records from the same time window, another operator can reproduce the boundary at which the expected state broke.

1. Pin the model and runtime digests, hardware, and precision. 2. Record the input and output length distributions and the warmup and measurement times. 3. Compare the TTFT, TPOT, throughput, error, and memory distributions per concurrency level. 4. At the chosen concurrency level, verify bursts, cancellations, and long-running load separately.

CHAPTER 2 / 5

Fix the lab target for changing concurrency

Commands for reproducing the isolated environment · do not run them in the browser
jq -r '.runs[] | [.concurrency,.p95_ttft_seconds,.tokens_per_second,.errors] | @tsv' capacity.json

CHAPTER 3 / 5

Distinguishes p95 TTFT output from its meaning

Expected output for training · not an actual measurement
4	0.7	420	0
16	2.8	710	0

CHAPTER 4 / 5

Decides whether the SLO assessment proceeds or stops

CHAPTER 5 / 5

Re-verify recovery of performance and capacity verification

CONCRETE CASES

From the fixed fixture below, choose the candidate that meets the 1-second TTFT target and write down the additional tests. Do not generate real load.

In this learning fixture, with a load of 2,048 input and 256 output tokens, p95 TTFT is 0.7 seconds at concurrency 4 and 2.8 seconds at 16. If the target is 1 second or less, do not approve the second configuration, even though its total throughput is higher. These figures are a fixture for practicing judgment, not a performance prediction.

Wrong responses and boundaries to check

A TPOT calculation must state the number of output tokens and the aggregation definition. A request that produced only the first token cannot be divided the same way. Before real measurement, capacity is unconfirmed.

If the stop line is crossed, stop new load and save the state of in-flight requests, memory, and the queue. Return to the last concurrency level that passed, then re-measure with the same input distribution and cache conditions. After recovery, measure again with the same commands and the same success criteria. Do not close an incident just because things appear normal.

INTERACTIVE LAB 1 / 2

Lab 1 · Find the basis for a verdict in the output

Enter values in the browser and check the execution results and the failure and recovery paths. No commands are ever sent to real equipment or the NAS.

Lab scenario:: From the fixed fixture below, choose the candidate that meets the 1-second TTFT target and write down the additional tests. Do not generate real load. Instructions:: In the browser, read the training output below and write a verdict. Do not send the commands to real equipment. To reproduce the commands separately, prepare an approved isolated environment with the relevant tools and example files. Save the entire output, and if the TTFT target is exceeded, OOM occurs, or cancellations rise, do not move on to the next change.

4	0.7	420	0
16	2.8	710	0

The point is not to memorize the values themselves but to confirm that zero errors and higher throughput alone cannot excuse a violation of the TTFT target. The values shown are reproduced examples for training, not measurements taken on real equipment. Identifiers and values can differ by device, driver, and cluster.

INTERACTIVE LAB 2 / 2

Lab 2 · Plan for stopping and recovery

Enter values in the browser and check the execution results and the failure and recovery paths. No commands are ever sent to real equipment or the NAS.

A TPOT calculation must state the number of output tokens and the aggregation definition. A request that produced only the first token cannot be divided the same way. Before real measurement, capacity is unconfirmed.

KEY TERMS

Key terms in this unit

TTFT (Time To First Token)
The time from sending the request until the first output token is received.

UNIT WORKBOOK

Exercises and worksheets for applying concepts to new situations

Start by checking basic principles, then expand to practical workplace decisions. After submitting an answer, you can see why every option is correct or incorrect, not just the correct answer.

Document the stop conditions and recovery evidence for performance and capacity verification in a work record.

PERSONAL WORKSHEET

A learning worksheet you adapt to your own environment

Your input remains only on the current browser screen and is not stored or transmitted externally. Use categories and pseudonyms instead of actual sensitive information.

OFFICIAL SOURCES

Verify against official sources

Reviewed against official documentation and training output. Commands and performance tests on real hardware are unconfirmed.

DECISION ACTIVITY

After deploying a new model you still get HTTP 200 but the answers changed. What do you check first?

First write down the evidence you need and the stop criteria, then choose a verdict.

Choose an answer

THREE-LEVEL ASSESSMENT

From basic principles to operational decisions

When you submit an answer you can see why every option is right or wrong.

Basic Question 1

Why does Triton separate server live from model ready?

Choose an answer
Apply Question 2

In a streaming request, the first token arrives quickly, but the output then stalls. What should you look at together?

Choose an answer
Capstone Question 3

Which result lets you approve the capacity?

Choose an answer

LEARNING RECORD

Have you reviewed the text, decision activities, and all explanations?

Completion status is stored only in this browser.